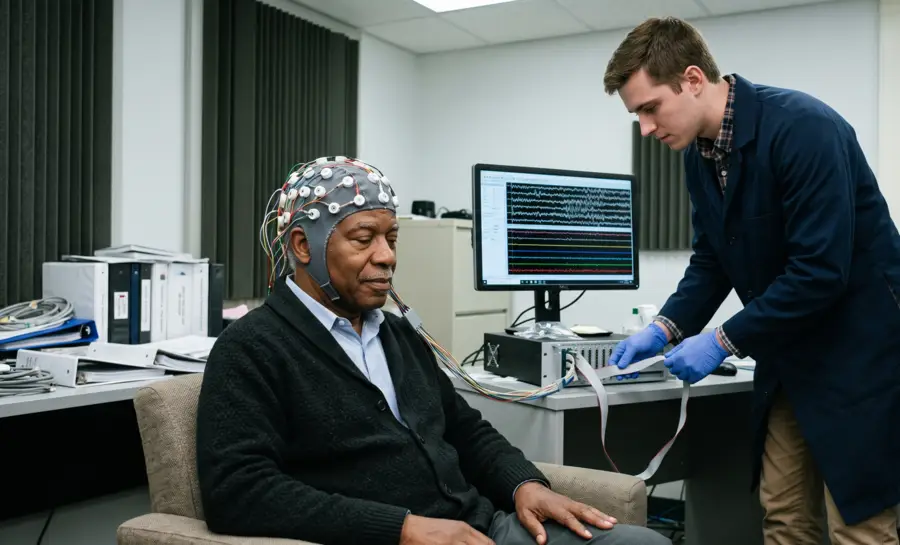
The electrical activity of the human brain is often introduced through a familiar set of categories. We learn to picture the mind as a switchboard, flipping between “alpha states” of calm, “beta states” of focus, or “theta states” of drowsiness. This division of the Electroencephalogram (EEG) into discrete, named frequency bands is a historical convention that made early research manageable. It transformed a complex waveform into a manageable set of labels.
This categorical view, however, is a simplification that can obscure a deeper reality. The brain’s electrical oscillations form a single, continuous spectrum of activity. Therefore, to analyze brain function by only looking at predefined bands is akin to judging a painting by separating it into colored squares without observing how the colors blend and transition.
What are Brain Frequencies?
Brain frequencies are descriptions of how often electrical activity oscillates over time, expressed in hertz (Hz), or cycles per second. They do not represent separate substances or isolated parts of the mind.
Instead, they summarize recurring patterns in the activity of large groups of neurons. The term brain frequency is therefore most useful when paired with information about location, timing, task, and the method used to record the signal.
The Different Types of Brain Wave Frequency
Researchers often divide oscillatory activity into frequency bands.
Delta is the slowest commonly discussed band and is strongly associated with deep, non-rapid-eye-movement sleep.
Theta activity is frequently observed during sleep and has also been studied in relation to memory and navigation.
Alpha activity is prominent in some relaxed, awake states, while beta activity is commonly examined during alert mental engagement.
Gamma refers to faster activity, although its boundaries vary between studies and measurement systems.
These labels are convenient summaries, not rigid biological compartments. A person can show several bands at once, and the same band can be involved in more than one process.
For example, alpha activity is not simply a “relaxation wave”; research also connects it with attention and the suppression of distracting information. The neuroscience of brain rhythms emphasizes that synchronized neuronal activity, inhibitory circuits, and communication across regions all contribute to the patterns recorded as waves.
Frequency bands also differ in how confidently they can be interpreted. A visible rhythm may reflect a mixture of neural sources, muscle activity, eye movements, or environmental noise. Researchers therefore examine amplitude, phase, spatial distribution, and changes over time rather than treating a band label as a diagnosis or a direct readout of a person’s thoughts.
How Fourier Transforms Extract Brain Frequency Data
An EEG electrode captures a complex and irregular voltage signal that fluctuates over milliseconds. This raw time-domain signal, a jagged line tracing the brain’s electrical potential, is not immediately meaningful as a "frequency." The core mathematical tool used to extract frequency information from this apparent chaos is the Fourier transform.
This algorithm works by decomposing the complex waveform into a sum of many pure sine waves, each oscillating at a different speed. The output of this process is a power spectrum. This is a plot that shows how much power, or amplitude squared, is present at every continuous frequency within the signal.
Imagine the raw EEG as a complex chord played by an orchestra. The Fourier transform allows us to separate that sound and see exactly how loudly the cello, the violin, and the flute are each playing, mapping their contribution across all possible notes.
Once the continuous power spectrum is computed, we are no longer constrained by pre-labeled categories, and we can calculate continuous summary metrics that describe the shape of the entire spectral graph.
For example, the median frequency is the point that splits the spectrum into two halves of equal power. The bandwidth describes how spread out the power is across the frequencies, indicating whether the activity is concentrated in a narrow range or distributed broadly.
These metrics are dynamic, allowing researchers to measure subtle, moment-by-moment shifts in the brain’s overall spectral balance rather than just observing arbitrary jumps from one categorical bin to another.
Exploring the Full Human Brain Frequency Spectrum
When we abandon categorical bins, the true scale of the brain’s frequency spectrum becomes apparent. It extends far below the traditional 1 Hz delta wave down into the realm of infraslow fluctuations, cycles that can last from 10 to 100 seconds (0.01–0.1 Hz). Simultaneously, it reaches far above the typical 40 Hz gamma range up to fast ripples, bursts of activity nearing 1000 Hz.
What part of this continuum we can “see” depends critically on the tool used to look. Standard clinical macroelectrodes, the size of a small coin, sample electrical activity from broad populations of neurons. Research by Worrell et al. comparing these clinical electrodes to tiny microwires, which are fine enough to record from sub-millimeter neuronal assemblies, found that the distribution of high-frequency oscillations recorded from macroelectrodes gets concentrated in a lower range, with an average frequency around 116 Hz.
In contrast, microwires record a much broader distribution of high-frequency activity extending up to the full 1000 Hz fast-ripple range, with an average ripple frequency closer to 143 Hz. These findings suggest that the scale of our measurements shapes our perception of the spectrum.
Moreover, the authors suggest that infraslow fluctuations are far from background noise. The phase of these slow, rolling waves, their exact position in a cycle from peak to trough, robustly correlates with the amplitude of faster oscillations ranging from 1 to 40 Hz.
This suggests a hierarchical and continuous coupling across the entire frequency spectrum, where the slowest rhythms act as a global organizer, orchestrating the excitability and power of faster rhythms.
Aspect | Macroelectrodes | Microwires |
|---|---|---|
Sample size | Broad neuron populations | Sub-millimeter assemblies |
High-freq average | \~116 Hz | \~143 Hz |
Range seen | Lower range | Up to 1000 Hz |
Measuring Consciousness on a Continuous Frequency Spectrum
Viewing brain frequency as a continuous metric provides a sensitive lens for observing transitions in mental states, particularly the fading and returning of consciousness. The process is not one of switching from one "band" to another but of a gradual sliding of the entire spectral distribution.
During a study of propofol-induced anesthesia, subjects gradually lost and then recovered the ability to respond to auditory cues. Researchers found that the median frequency and bandwidth of the frontal EEG power spectrum tracked the probability of a subject responding to these stimuli with high precision.
As a person drifted into unconsciousness, the center of their brain’s spectral power shifted downwards, and its distribution changed, all without respecting any predefined alpha or beta boundaries. The loss of consciousness was marked by an increase in very low-frequency power (\<1 Hz) and the appearance of a distinct frontal alpha oscillation pattern.
Furthermore, the recovery of consciousness was predicted not just by the shift in median frequency but by a specific relationship, a phase-amplitude coupling, between slow and fast rhythms. During the transition back to awareness, the amplitude of alpha oscillations became maximal at the trough of the slow-wave cycle. This precise, continuous relationship predicted the moment of behavioral response, a phenomenon that a standard band-power analysis could easily miss.
This highlights how continuous spectral features can provide a smooth and accurate readout of an internal cognitive state.
Predicting Sensory Perception with Brain Frequency Analysis
The functional significance of viewing the spectrum as a whole is further revealed at its slowest end. Our ability to detect a faint sensory stimulus, a quiet beep or a light touch, is not a perfectly consistent performance; it waxes and wanes over time. This "streaking effect" in human psychophysical performance is directly linked to the continuous infraslow fluctuations in the brain’s baseline activity.
In a somatosensory detection task, the phase of ongoing infraslow fluctuations (0.01–0.1 Hz) strongly predicted whether a subject would perceive a weak stimulus. Not the amplitude of these slow waves, but their precise phase, the moment in their long, slow cycle when the stimulus arrived, determined detection. The brain’s very slowest rhythm appeared to dictate the on-off gating of conscious perception.
This connection extends to faster activity, revealing a unified network dynamic. The same infraslow phase that predicts behavioral performance also robustly controls the amplitude of neuronal oscillations in the 1–40 Hz range.
The phase of the slow fluctuations reflects a sweeping cycle of global cortical excitability. At one phase, networks are more excitable, amplifying faster rhythms and making perception likely. At another phase, they are inhibited.
This further demonstrates that the continuous frequency spectrum reflects a unified excitability cycle of cortical networks, from the infraslow foundational rhythm up through the faster oscillations that process sensory information.
Evaluating the Clinical Utility of Continuous EEG Metrics
The conceptual shift from categorical bands to continuous spectral analysis carries the popular, intuitive promise that metrics like median frequency will yield more reproducible and robust biomarkers for neurological and psychiatric conditions. The hope is that by avoiding the arbitrary slicing of the spectrum, we can bypass the diagnostic overlap and variability that plague discrete band analysis.
While this logic is powerful, it remains largely an untested hypothesis at the population level. The current evidence base is limited and mixed.
Single primary studies, such as the anesthesia research, demonstrate that continuous metrics can track a specific, highly controlled state change within individuals with remarkable fidelity. However, the wider diagnostic literature, which is dominated by band-based approaches, is cautious about its conclusions. A 2019 review of 184 resting-state studies found that the magnitudes of reported band-based differences are typically small, between 20% and 30%, and correlate weakly with symptom severity scores.
Because the rigorous head-to-head evidence for continuous metrics over categorical bands is currently sparse, any claim of superior clinical utility or diagnostic power must be framed as a potential benefit, a popular claim not yet robustly demonstrated.
We do not yet know if calculating a median frequency will solve the reproducibility issues that arise when we label power as “theta” or “alpha.” The move toward a spectral view is a logic-based conceptual reframing, but its clinical translation demands the same rigorous, large-scale validation that has challenged the band-based paradigm it seeks to replace.
Why the Brain's Full Frequency Spectrum Matters for Understanding Consciousness
In neuroscience, brain electrical activity is best understood as one continuous spectrum, stretching from infraslow cycles to ultra-fast ripples, and this unified view reveals relationships that fixed labels like alpha or beta tend to hide.
The slowest rhythms orchestrate faster oscillations into a global cycle of excitability, with spectral shifts closely tracing the loss and recovery of consciousness and even predicting whether a faint stimulus will be perceived. Continuous measures such as median frequency and bandwidth capture the overall shape of brain activity, offering a smooth and dynamic readout of mental states rather than a forced placement into arbitrary bins.
This reframing carries a genuine promise for improving diagnosis, but that promise remains a possibility rather than a proven clinical advantage. Controlled studies show remarkable precision in tracking state changes like anesthesia, while large-scale evidence comparing continuous metrics to traditional band-based methods is still limited.
The meaningful next step is to test whether this richer, more faithful view of the spectrum can outperform older categories in real-world medical settings.
References
Worrell, G. A., Gardner, A. B., Stead, S. M., Hu, S., Goerss, S., Cascino, G. J., ... & Litt, B. (2008). High-frequency oscillations in human temporal lobe: simultaneous microwire and clinical macroelectrode recordings. Brain, 131(4), 928-937. https://doi.org/10.1093/brain/awn006
Purdon, P. L., Pierce, E. T., Mukamel, E. A., Prerau, M. J., Walsh, J. L., Wong, K. F. K., ... & Brown, E. N. (2013). Electroencephalogram signatures of loss and recovery of consciousness from propofol. Proceedings of the National Academy of Sciences, 110(12), E1142-E1151. https://doi.org/10.1073/pnas.1221180110
Monto, S., Palva, S., Voipio, J., & Palva, J. M. (2008). Very slow EEG fluctuations predict the dynamics of stimulus detection and oscillation amplitudes in humans. Journal of Neuroscience, 28(33), 8268-8272. https://doi.org/10.1523/JNEUROSCI.1910-08.2008
Newson, J. J., & Thiagarajan, T. C. (2019). EEG frequency bands in psychiatric disorders: a review of resting state studies. Frontiers in human neuroscience, 12, 521. https://doi.org/10.3389/fnhum.2018.00521
Frequently Asked Questions
Why is the traditional division of brain waves into discrete bands (like alpha, beta, theta) considered a simplification?
The brain’s electrical oscillations form one continuous spectrum, not isolated boxes, and fixed bands obscure how frequencies blend and transition. A review of resting-state studies showed that power patterns within these bands overlap across different psychiatric conditions, suggesting that categorical slicing may hide more than it reveals.
How does the Fourier transform help in analyzing brain frequency?
An EEG electrode records a complex, irregular voltage signal over time, not a single pure frequency. The Fourier transform mathematically decomposes this signal into a sum of pure sine waves, producing a power spectrum that shows how much power exists at every continuous frequency.
What is the actual range of brain frequencies beyond the traditional bands?
The frequency spectrum extends from infraslow fluctuations, which cycle every 10 to 100 seconds (0.01–0.1 Hz), up to fast ripples nearing 1000 Hz. This range far exceeds the typical 1 Hz delta and 40 Hz gamma categories.
How does the measurement tool affect what we see in high-frequency brain activity?
Standard clinical macroelectrodes sample broad populations and concentrate high-frequency activity around an average of 116 Hz, while microwires recording from smaller assemblies show a wider distribution up to 1000 Hz, with an average closer to 143 Hz. The scale of measurement therefore shapes the apparent range of the spectrum.
How do continuous spectral metrics track the loss and recovery of consciousness during anesthesia?
As a subject drifts into unconsciousness, the median frequency of the brain’s power spectrum shifts downward, and the loss of consciousness is marked by increased very low-frequency power and a distinct frontal alpha pattern. Recovery is predicted by a phase-amplitude coupling where alpha oscillations become maximal at the trough of the slow-wave cycle.
How do infraslow brain fluctuations influence our perception of faint stimuli?
The phase of infraslow fluctuations (0.01–0.1 Hz) predicts whether a weak stimulus is detected, not their amplitude. This slow phase reflects a global cycle of cortical excitability, where faster oscillations (1–40 Hz) are modulated, making perception more or less likely at different moments.
Why is the concept of phase-amplitude coupling important for understanding consciousness?
Phase-amplitude coupling refers to how the timing (phase) of slow rhythms controls the amplitude (strength) of faster rhythms. During recovery from anesthesia, the specific relationship where alpha amplitude peaks at the trough of slow waves predicted the moment of behavioral response, something standard band-power analysis would miss.
What is the main promise of using continuous spectral metrics like median frequency and bandwidth?
These metrics describe the overall shape of the entire power spectrum, allowing researchers to track gradual shifts in brain activity rather than forced jumps between predefined bands. They provide a smooth, sensitive readout of cognitive states, as seen in anesthesia and perception studies.
What is the "bandwidth" of the power spectrum and why is it useful?
Bandwidth indicates how spread out the power is across frequencies—whether brain activity is concentrated in a narrow range or distributed broadly. This is a continuous descriptor that, along with median frequency, helps quantify the dynamic shape of the entire spectrum rather than just individual bands.
Emotiv is a neurotechnology leader helping advance neuroscience research through accessible EEG and brain data tools.
Medical Disclaimer: The information provided on this website is for educational and informational purposes only and is not intended as medical or health advice. This content may contain errors and should not be relied upon to make life-altering health, medical, or lifestyle choices. Always seek the advice of your physician or other qualified health provider with any questions you may have regarding a medical condition or treatment.
Christian Burgos