Power spectral density, or PSD, is the tool that unmixes EEG signals and tells you how much energy each of those speeds, or frequencies, contributes to the overall recording. Once you can read a PSD plot, you are reading a kind of rhythm score for the brain, a chart that shows which tempos dominate and which ones fade into the background.
What Is Power Spectral Density in EEG?
Think of the raw EEG trace as a chord played by an orchestra where every instrument is a different frequency of brain wave. You cannot tell by ear alone how much each instrument contributes.
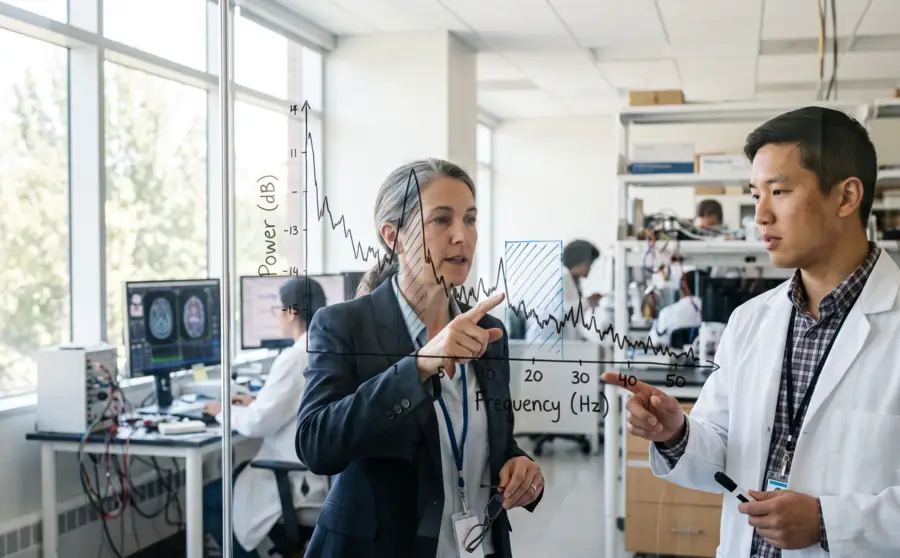
PSD solves this by calculating the squared amplitude of the signal at each frequency and averaging that measurement across a stretch of recording time. The result is a curve with frequency on one axis and power on the other, showing exactly how the brain's electrical activity is distributed across slow and fast rhythms.
PSD compresses an entire recording period into one curve, so it tells you about the overall balance of frequencies during that window rather than tracking how the mixture shifts from second to second. That’s crucial since a person's brain state can change quickly, but a standard PSD plot averages those changes out.
Researchers comparing medical grade and consumer EEG headsets used a specific calculation method for this averaging, called Welch's modified periodogram, which breaks the recording into overlapping segments and averages their spectra to produce a cleaner, less noisy PSD estimate.
This kind of signal processing step is standard practice for producing a PSD curve that reflects the underlying brain activity rather than random fluctuation.
Calculating Power Spectral Density Step by Step
Calculating PSD usually involves a sequence of signal-quality and signal-processing decisions rather than a single command. The recording is first checked for missing data, unsuitable channels, and prominent artifacts. Analysts then select segments, remove or model slow trends when appropriate, apply a window, transform the data into the frequency domain, and scale the result.
The resulting spectrum should be inspected alongside the original time series and, where relevant, annotations for movement, electrode disruption, eye activity, muscle activity, or experimental events. This comparison helps distinguish a genuine rhythmic pattern from a transient disturbance that happens to produce spectral power.
A practical workflow can be organized into the following stages:
Verify the sampling rate, channel labels, reference, and recording duration.
Identify usable epochs and address artifacts or rejected segments.
Choose segment length, overlap, window, and frequency range.
Estimate and scale the PSD, then inspect peaks and band-limited power.
Document parameters so the result can be reproduced and compared.
These steps make the calculation traceable. They also prevent a visually attractive spectrum from being treated as independent of the preprocessing and estimation choices that produced it.
Common Methods: Periodogram and Welch's Method
A periodogram computes the squared magnitude of the Fourier transform for a selected segment. It is straightforward and can provide fine nominal frequency spacing when the segment is long, but its estimate may fluctuate substantially from one frequency bin to the next. This variability is especially relevant for noisy biological recordings.
Welch’s method divides the signal into overlapping segments, applies a window to each segment, computes a periodogram for each one, and averages the results. Averaging generally produces a smoother, lower-variance estimate, while the shorter segments can reduce frequency resolution. The best balance depends on whether the analysis emphasizes narrow peaks, broad bands, or stable average activity.
The difference is not merely cosmetic. A smoother spectrum can make broad patterns easier to compare, but excessive averaging may obscure short-lived or narrowly localized changes. For time-varying EEG, a time-frequency approach may be more appropriate than a single PSD across the entire recording.
What a Healthy Resting-State EEG Spectrum Looks Like
If you sit a healthy adult down, ask them to relax, and record their EEG, the resulting PSD curve has a recognizable shape. Power is highest at the lowest frequencies and falls off steadily as frequency increases, producing that 1/f-like decline.
This falling curve reflects the aperiodic component described above, and its steepness is captured by a single number called the spectral exponent, sometimes written as β. A steeper decline means a larger negative exponent; a flatter decline means the power is more evenly spread across frequencies.
Sitting on top of this background decline, a resting brain with eyes closed typically produces a visible bump around 8 to 12 Hz, the alpha peak. This bump is usually strongest over the back of the head. Open the same person's eyes, and that alpha peak shrinks noticeably.
A direct comparison by Ratti et al. of medical-grade EEG systems and consumer headbands recorded exactly this pattern: across every system tested, the largest rhythmic signature in the data was a posterior alpha rhythm that responded predictably to eyes-closed versus eyes-open conditions.
That same comparison also asked a more practical question: if you record the same person twice, on two separate visits, does the PSD curve look the same?
The answer depended heavily on equipment quality. Medical-grade systems produced Fp1 electrode PSDs (Fp1 sits on the forehead and was the one electrode common to all four systems tested) that were consistent across visits, while a consumer system showed the highest relative variation between test and retest sessions. This tells us that a well-behaved PSD curve is not just a property of the brain, it is also a property of how carefully the signal was captured.
How Anesthesia Changes the Brain's Spectral Signature
The static PSD becomes especially informative when the brain's state changes dramatically, and no example is more direct than anesthesia. A 2019 study by Colombo et al. recorded resting EEG in healthy volunteers before and during anesthesia with three different agents: xenon, propofol, and ketamine.
After each session, researchers asked whether the person had any memory of conscious experience during the unresponsive period, distinguishing states where consciousness was reported from states where it appeared absent or inaccessible to recall.
The spectral exponent tracked this distinction closely. Xenon and propofol, both agents associated with a loss of conscious experience, caused a substantial decrease in the negative spectral exponent within each subject, meaning the PSD curve became noticeably steeper. This steepening across the broad 1 to 40 Hz range appears to index the absence of conscious experience rather than simple unresponsiveness.
Ketamine told a different story. Even though subjects were behaviorally unresponsive under ketamine, they typically retain some conscious experience, and the overall PSD decay looked similar to normal wakefulness. The one exception was a flattening of the curve specifically in the 20 to 40 Hz range, a detail that lines up with ketamine's distinct mechanism of action compared to the other two agents.
Perhaps the most compelling piece of evidence was a correlation between this spectral exponent and a separate, independently derived measure called the Perturbational Complexity Index, or PCI, which is generated from a different technique that stimulates the brain and measures how complex the resulting response is. The high correlation between these two very different measurements supports the idea that the spectral exponent is not a coincidental pattern but a genuine marker connected to the presence of consciousness itself.
How ADHD Alters the EEG Power Spectrum
The same aperiodic decline that shifts under anesthesia also appears to differ in children with ADHD. A study of children between 3 and 7 years old, comparing those with ADHD to typically developing peers, measured spectral slope and offset (the height of the aperiodic curve) alongside more traditional measures like peak alpha frequency and band power ratios.
Medication-naive children with ADHD showed higher alpha power, greater aperiodic offsets, and steeper spectral slopes compared to typically developing children. This steepening pattern is worth pausing on, because it echoes the same direction of change seen in the anesthesia study, even though the two conditions are obviously not comparable in severity or mechanism.
The spectral slope also correlated with the traditional theta/beta ratio used in ADHD research for years, suggesting that slope captures overlapping information while potentially offering a cleaner, more comprehensive marker.
An additional detail adds weight to this finding. Children with ADHD who had been treated with stimulant medication, even after a 24-hour washout period during which the medication's active effects should have worn off, showed slopes and offsets that looked comparable to the typically developing group.
This raises the possibility that the altered spectral pattern in ADHD is not fixed, though the study frames this as a hint rather than a confirmed treatment effect. Because spectral slope has also been linked in past research to executive functioning and to the balance between excitatory and inhibitory brain activity, the authors suggest the altered slope may reflect something meaningful about the underlying condition rather than being a statistical artifact of the theta/beta ratio calculation.
Group | Spectral Slope | Alpha Power | Offset |
|---|---|---|---|
Typically Developing | Normal slope | Normal power | Normal offset |
ADHD, medication-naive | Steeper slope | Higher power | Greater offset |
ADHD, stimulant-treated | Similar to typical | Not reported | Similar to typical |
Using Power Spectral Density to Classify Epileptic Seizures
Consciousness and attention are not the only domains where a static PSD proves useful. Epilepsy classification offers a more automated, computational example.
One approach converted epileptic EEG recordings into what the researchers called power spectrum density energy diagrams, essentially visual representations of the PSD, and then fed these images into a deep convolutional neural network, a type of machine learning model well suited to recognizing patterns in image-like data.
The model was trained to sort EEG segments into four categories:
Interictal (between seizures)
Two different preictal windows (30 minutes and 10 minutes before a seizure begins)
The seizure state itself
Using a public epilepsy dataset, this method reached an average classification accuracy above 90 percent across all four categories. The result confirms that the overall shape of the static PSD carries enough distinguishing information for an algorithm to reliably tell these clinically important brain states apart, without needing to track moment-by-moment changes in the signal.
Common Pitfalls When Interpreting PSD
A PSD curve is only as trustworthy as the recording it came from, and several practical issues can distort the shape of that curve in ways that have nothing to do with underlying brain function.
Artifacts are the most immediate concern. Eye blinks and muscle movement generate their own electrical signals that get picked up by scalp electrodes, particularly at frontal sites.
The comparison of consumer and medical-grade EEG systems found that consumer devices were more prone to this kind of contamination, and one consumer headband in particular showed a broadband increase in power across the spectrum, a signature consistent with muscle and blink artifact rather than genuine neural rhythm. Thus, careful cleaning of the data and selection of low-artifact segments before calculating a PSD is a necessary step, not an optional one.
Volume conduction is another widely discussed limitation in EEG research generally because electrical fields spread through tissue and skull before reaching the scalp, a single source of activity in the brain can register on multiple nearby electrodes simultaneously, blurring the spatial precision of any given PSD reading.
Reference choice presents a similar situation. EEG is inherently a differential measurement, meaning every electrode's signal is calculated relative to some reference point, whether that is an average of all electrodes, a mastoid bone behind the ear, or a central scalp location like Cz. Changing that reference point can redistribute power across channels and alter the absolute shape of a PSD curve.
Therefore, awareness of which reference was used is often a standard piece of information to check when comparing PSD findings across different papers or datasets.
Lastly, there’s the test-retest reliability. Even holding the subject and the equipment constant, repeated recordings on separate visits can show some natural variation in the PSD curve.
Medical-grade systems produced more consistent Fp1 PSDs across two visits, while the consumer system tested showed the largest relative variation. This is a practical caution against reading too much into small PSD differences observed in a single subject, particularly when the recording equipment or protocol is not tightly controlled.
Tools and Software for Computing Power Spectral Density
PSD can be computed with scientific programming libraries, dedicated EEG analysis packages, or general signal-processing software. The essential requirements are access to the sampled data and transparent control over sampling rate, segmenting, windowing, detrending, overlap, scaling, and frequency limits. A graphical output alone is not enough to establish how the estimate was produced.
A reproducible implementation records the preprocessing and estimation parameters alongside the spectrum. It also preserves the channel reference, units, rejected epochs, and any transformations applied before calculation. These details are particularly important when results are used in a group comparison or combined across recording sessions.
Results are easier to audit when the workflow produces both numerical arrays and diagnostic plots. Useful checks include the original waveform, artifact-marked intervals, the selected frequency range, and a comparison of estimates across reasonable segment choices. Such checks do not make the interpretation automatic, but they make hidden assumptions easier to detect.
Conclusion
The power spectral density plot acts as a rhythm score for the brain, and the steepness of its background decline emerges as a remarkably consistent marker across vastly different mental states.
Whether a person loses consciousness under certain anesthetics, a child shows attention difficulties linked to ADHD, or a seizure begins, this overall shape shifts in predictable ways, connecting these conditions through a shared measurable signature. This pattern suggests that the brain’s resting electrical profile holds meaningful, cross-cutting clues about its functional state, not just isolated peaks at specific frequencies.
While the PSD gives only a static average over a recording window, its ability to reliably tell conscious from unconscious periods or to let algorithms spot seizures with high accuracy demonstrates its practical worth in neuroscience. These correlations do not prove what causes these states, but they offer an accessible, single-number summary—the slope of the curve—that can help gauge consciousness, attention differences, or seizure risk.
For researchers and clinicians, that simple measure provides a powerful entry point into brain dynamics, bridging abstract rhythms to real-world differences.
References
Ratti, E., Waninger, S., Berka, C., Ruffini, G., & Verma, A. (2017). Comparison of Medical and Consumer Wireless EEG Systems for Use in Clinical Trials. Frontiers in human neuroscience, 11, 398. https://doi.org/10.3389/fnhum.2017.00398
Colombo, M. A., Napolitani, M., Boly, M., Gosseries, O., Casarotto, S., Rosanova, M., ... & Sarasso, S. (2019). The spectral exponent of the resting EEG indexes the presence of consciousness during unresponsiveness induced by propofol, xenon, and ketamine. NeuroImage, 189, 631-644. https://doi.org/10.1016/j.neuroimage.2019.01.024
Robertson, M. M., Furlong, S., Voytek, B., Donoghue, T., Boettiger, C. A., & Sheridan, M. A. (2019). EEG power spectral slope differs by ADHD status and stimulant medication exposure in early childhood. Journal of neurophysiology, 122(6), 2427-2437. https://doi.org/10.1152/jn.00388.2019
Gao, Y., Gao, B., Chen, Q., Liu, J., & Zhang, Y. (2020). Deep convolutional neural network-based epileptic electroencephalogram (EEG) signal classification. Front. Neurol. 11, 375 (2020). https://doi.org/10.3389/fneur.2020.00375
Frequently Asked Questions
What is power spectral density (PSD) in EEG?
PSD is a method that calculates the squared amplitude of EEG signals at each frequency and averages this over a recording period. The resulting curve shows how energy is distributed across slow and fast brain rhythms, unmixing the complex raw trace.
What does a healthy resting-state PSD curve look like?
Power is highest at low frequencies and declines steadily with frequency, creating a 1/f-like background. A visible alpha peak around 8–12 Hz typically appears over the back of the head when eyes are closed and diminishes when eyes open.
How does the aperiodic component differ from oscillatory peaks?
The aperiodic, or 1/f-like, component is the smooth decline in power as frequency increases, without forming distinct bumps. Oscillatory peaks, such as the alpha rhythm, rise above this background at specific frequencies and carry different information about brain function.
How does anesthesia change the brain’s spectral signature?
Agents like xenon and propofol, which lead to loss of conscious experience, cause the PSD curve to become steeper over 1–40 Hz. Ketamine, which preserves conscious experience despite unresponsiveness, shows a curve similar to wakefulness except for a flattening in the 20–40 Hz range.
What PSD differences are found in children with ADHD?
Children with ADHD show higher alpha power, larger aperiodic offsets, and steeper spectral slopes compared to typically developing peers. After stimulant treatment, even with a washout, slopes and offsets can resemble those of the typically developing group.
How can PSD classify epileptic seizure states?
A static PSD curve can be converted into an image and fed into a deep neural network to distinguish interictal, preictal, and seizure states. This approach achieved high classification accuracy in at least one study, confirming that the overall spectral shape carries enough distinguishing information.
Why is PSD considered a static snapshot?
PSD compresses an entire recording period into one curve, averaging out second‑by‑second changes. It reveals the overall frequency balance during that window rather than tracking how the mixture shifts over time.
What are common pitfalls when interpreting PSD?
Muscle and eye artifacts can contaminate the signal and distort the curve, especially in consumer devices. Volume conduction and reference choice also influence PSD shape, and even with stable equipment, natural test‑retest variation means small differences may not be meaningful.
What is the difference between PSD and an amplitude spectrum?
PSD represents squared amplitude per frequency and is suitable for calculating power, while an amplitude spectrum represents frequency-component magnitude and uses different units.
Does a larger PSD peak always indicate stronger brain activity?
No. A larger peak may reflect artifacts, reference effects, recording conditions, or analysis parameters as well as physiological activity.
Emotiv is a neurotechnology leader helping advance neuroscience research through accessible EEG and brain data tools.
Medical Disclaimer: The information provided on this website is for educational and informational purposes only and is not intended as medical or health advice. This content may contain errors and should not be relied upon to make life-altering health, medical, or lifestyle choices. Always seek the advice of your physician or other qualified health provider with any questions you may have regarding a medical condition or treatment.
Christian Burgos