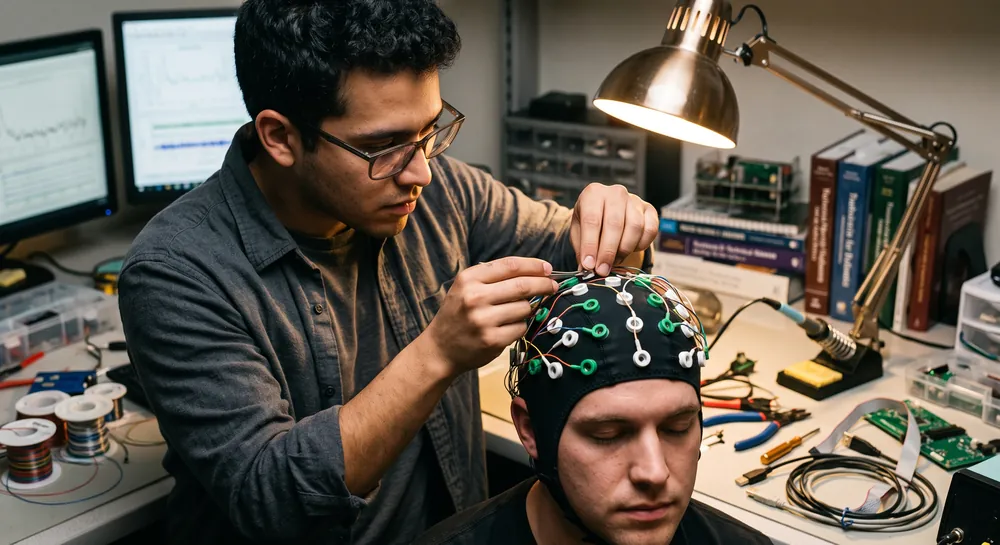
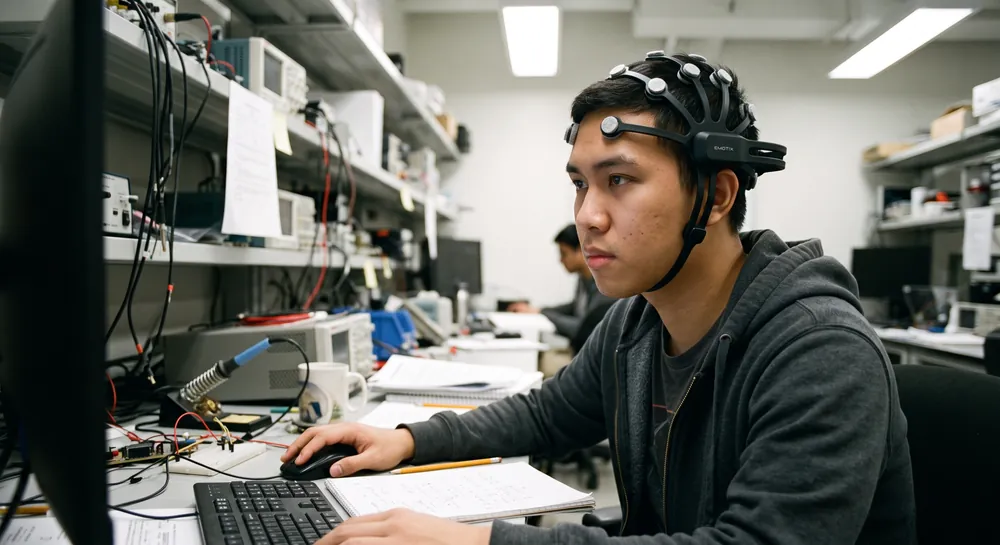
The Fourier transform changes the way existing information is displayed, converting a signal that varies over time into a description of the rhythmic components already buried inside it. Understanding this transform as a lens, rather than a device, is the necessary first step before any conversation about brain rhythms, frequency bands, or spectral patterns can make sense.
What an EEG Trace Actually Represents
An electroencephalogram records voltage as it changes from one moment to the next. Plotted out, this produces a single continuous line, a time series, moving up and down as electrical activity beneath the electrode shifts. On its own, this line looks like one unified event. But that appearance is misleading.
In reality, the voltage recorded at any single instant is the combined result of many separate oscillatory processes happening simultaneously within the underlying neural tissue. Some of these processes cycle slowly, others quickly. When they occur together, their individual patterns add together into one composite waveform, the same way multiple instruments playing different notes blend into a single chord. The listener hears one sound, but that sound is secretly made of several distinct pitches layered together.
An EEG trace works the same way. What looks like one erratic line is really several rhythms superimposed into a single signal.
The problem this creates is straightforward: if several rhythms are mixed together into one waveform, how can anyone identify which rhythms are present, or how strong each one is?
The Fourier Transform: A Lens, Not a Microscope
The Fourier transform answers that question, but not by discovering new data. It works by re-expressing the exact same EEG segment using a different coordinate system. Instead of describing the signal in terms of voltage across time, it describes the same signal in terms of frequency content, how much of each oscillatory rate is present within it.
The transform is mathematically reversible as it can convert an EEG epoch into its frequency representation, then convert it back, and the original time-based waveform reappears exactly as it was.
The two representations, time and frequency, contain identical information. They simply organize it differently, in the same way that sunlight passing through a prism does not create color. The color was already present in the white light. The prism only separates wavelengths that were already mixed together so they become visible individually.
The Fourier transform performs the equivalent separation on an EEG signal, making the rhythmic ingredients visible without altering the underlying recording in any way.
The Mathematical Foundations of the Fourier Transform
At its core, the transform relies on the integral evaluation of a signal multiplied by complex exponential functions. This operation calculates the correlation between the original waveform and sine waves of varying frequencies. If a specific frequency exists within the original signal, the integral yields a high value at that point in the frequency domain, representing local energy intensity.
Formal definitions utilize the Euler identity to bridge the gap between trigonometric functions and complex exponentials. The forward transform converts a continuous function f(t) into F(ω), while the inverse operation reconstructs the original signal through a summation of these synthesized components. This symmetry ensures that no information is lost during the conversion, allowing for a perfectly reversible mathematical transition.
Practitioners must pay close attention to normalization constants and convergence criteria when applying these integrals to physical data. Improper handling of integration bounds or signal definitions can lead to inaccurate spectral estimates. By respecting these mathematical boundaries, one ensures that the frequency domain representation remains a faithful reflection of the original time-dependent data stream.
Types of Fourier Transforms
Continuous vs Discrete Fourier Transform
The continuous transform applies to functions defined over an infinite time interval, whereas the discrete version operates on sampled, finite data sequences.
In practice, digital systems always utilize discrete processing, requiring careful consideration of sampling limits to represent continuous phenomena accurately. Various methods exist to approximate this transition without significant data loss, including:
Windowing functions that prevent spectral leakage by tapering input data edges.
Zero-padding techniques to increase the resolution of the resulting frequency bins.
Aliasing mitigation strategies that ensure signal integrity during the digitizing process.
Sampling theorem compliance to capture all relevant high-frequency information present.
Efficient computational mapping that scales with the number of input data points.
These considerations help dictate how effectively a discrete result mirrors the underlying continuous signal structure.
Fast Fourier Transform: Why Speed Matters
The development of efficient algorithms, such as the Fast Fourier Transform (FFT), enabled real-time spectral analysis in systems with massive data throughput. Without these optimizations, the computational complexity of standard discrete transforms would render modern diagnostic technologies unusable. The efficiency gains are starkly apparent when comparing calculation time for large datasets, as illustrated below.
Dataset Size | Computation Magnitude | Time Difficulty |
|---|---|---|
256 samples | Low | Minimal |
1,024 samples | Moderate | Efficient |
32,768 samples | High | Very Fast |
By converting an operation that scales quadratically into one that scales logarithmically, these tools facilitate rapid signal monitoring. Fast processing allows for instantaneous feedback loops, which are critical in environments where observing changes in real-time is the primary goal of the investigation.
The Periodicity Assumption Behind Every Fourier Calculation
When the Fourier transform processes a segment of signal, it mathematically treats that segment as though it repeats infinitely in both directions, forward and backward in time, forever. The short slice of EEG being analyzed is treated as one repeating unit in an endless loop.
Real EEG activity does not behave this way. Brain signals are not perfectly periodic, and a segment pulled from a continuous recording rarely starts and ends at values that would connect smoothly if looped back onto itself.
When the edges of the segment do not match, the assumption of infinite repetition introduces distortions at the boundaries, sometimes called edge artifacts or spectral leakage, where energy from one frequency appears to smear into neighboring frequencies that were not actually present in the original signal.
This is not a flaw that invalidates the method. It is a known mathematical tradeoff, and it is manageable when segments are chosen carefully. This is part of why frequency-based EEG analysis typically works with short, relatively stable stretches of signal rather than long, continuously changing recordings.
Jansen et al., for example, compared frequency-domain features across short EEG intervals rather than extended recordings, an approach consistent with keeping each analyzed segment brief enough that the periodicity assumption remains a reasonable approximation. A study by Vidyaratne et al. took a related but more specialized path, computing a harmonic wavelet packet transform, a technique built on the Fourier transform itself, to extract frequency information while addressing resolution limitations that come with analyzing brain signals that shift over time.
Both approaches show how practical EEG work accommodates a mathematical convenience that does not perfectly match biological reality, without abandoning the tool itself.
Why Frequency Content Matters for Reading Brain Activity
Once an EEG epoch has been converted into its frequency components, those components map onto categories that anyone who has read about brain activity has likely encountered: delta, theta, alpha, beta, and gamma bands. These labels describe ranges of oscillation speed, and they form the vocabulary used across sleep research, cognitive studies, and clinical diagnostics.
This decomposition is the conceptual foundation underneath essentially all frequency-based EEG interpretation. Any time a report mentions elevated activity in a particular band, or a shift in the balance between bands, that statement is only meaningful because the signal was first broken down using the logic the Fourier transform provides. Without this decomposition, there is no vocabulary for describing brain rhythms at all, just an unbroken voltage trace.
The claim that oscillatory frequency carries meaningful information about brain states is widely discussed across many areas of neuroscience.
What Fourier-Based Analysis Has Revealed About Seizure Activity
Separating Ictal and Seizure-Free Signals
Researcher Ram Bilas Pachori applied a technique called empirical mode decomposition to intracranial EEG signals, breaking each recording into a set of band-limited components known as intrinsic mode functions. He then used a Fourier-Bessel expansion to calculate the mean frequency of each of these components.
When comparing ictal signals, meaning those recorded during active seizure activity, against seizure-free signals, the mean frequency feature showed a statistically significant difference between the two states. The result demonstrates that frequency information extracted through a Fourier-based method carried a detectable signature tied to seizure activity.
Vidyaratne et al. pursued a related but more elaborate goal: detecting seizure onset in real time. This approach combined energy features from the harmonic wavelet packet transform, computed through the Fourier transform, with a separate measure called fractal dimension, which captures repeating self-similar patterns within the signal.
These combined features were organized spatially across electrode channels and temporally across a moving analysis window, then classified using a relevance vector machine, a method chosen for its efficiency with large, sparse feature sets.
Tested on long-term scalp EEG recordings, the system reached 96 percent sensitivity for detecting seizure onset, with a median false detection rate of just 0.1 events per hour and an average detection latency of 1.89 seconds. On short-term data, drawn from both scalp and intracranial recordings, classification accuracy reached 99.8 percent.
Together, these two studies show that oscillatory information extracted through Fourier-related decomposition carries diagnostically relevant content within the specific context of epilepsy detection.
Fourier Features Compared Against an Alternative Transform
Jansen et al. approached the question from a different angle, comparing two mathematical transforms directly against each other.
Rather than testing Fourier analysis in isolation, researchers compared features derived from the Fourier transform against features derived from the Walsh transform, a method that decomposes signals using rectangular, square-shaped functions instead of smooth sinusoids. Applied to short EEG intervals, features drawn from the Fourier transform consistently produced better classification results than those drawn from the Walsh transform.
This comparison suggests that sinusoidal building blocks may align more naturally with the underlying structure of EEG signals than blocky, rectangular alternatives, at least for the specific classification tasks the study examined.
How to Compute a Discrete Fourier Transform (DFT)
Computing a discrete transform starts with clean input data that is representative of the signal over a stable period. One must first ensure that the signal length matches the desired frequency resolution, then apply a windowing function to minimize spectral artifacts caused by finite data truncation. This preparatory work is essential to prevent significant errors during the calculation phase.
Once the signal is prepared, the actual computation involves applying the transformation formula across all sample points within the time-series window. Digital software platforms handle the heavy lifting, typically utilizing the Fast Fourier Transform (FFT) algorithm to execute millions of calculations per second and produce a clear amplitude spectrum. This output must then be scaled correctly to reflect the physical units of the input measurement (such as microvolts, or $\mu V$, in EEG), ensuring that the results remain interpretable for subsequent research.
Interpretation of the resulting spectral magnitude requires examining the data for distinct oscillatory patterns. While mechanical systems might reveal sharp, isolated peaks, biological signals like EEG often require analyzing the total power within broad frequency bands (e.g., the 8–12 Hz alpha band) rather than relying on discrete peaks alone. The physical significance of these spectral features depends heavily on the context, often indicating underlying physiological or mechanical behavior. By consistently following these steps, practitioners can extract meaningful, actionable frequency data from even the most complex observational waveforms.
Fourier Transform vs Other Frequency-Domain Methods
While highly versatile, the Fourier approach assumes stationary signals, which are stable over the measurement duration. In scenarios involving rapid, transient changes—such as an abrupt epileptic spike or a brief burst of sleep spindles—other methods like Wavelet Transforms provide better localization by maintaining time information alongside frequency details. Choosing the right tool requires evaluating whether the signal maintains a constant rhythmic structure or changes abruptly.
Alternative methods, such as Singular Spectrum Analysis (SSA), offer advantages for decomposing non-linear, unpredictable signals that standard transforms struggle to resolve. These methods often excel at extracting the signal trend versus oscillatory noise in complex, real-world physiological datasets. The choice hinges on the level of precision needed for temporal versus spectral accuracy in a specific research setup.
Ultimately, no single transformation method serves as a universal panacea for signal processing dilemmas. Practitioners must weigh the computational cost and mathematical constraints of each approach against their data characteristics. Integrating these varied perspectives ensures a robust, well-rounded diagnostic process that maximizes the fidelity of the final interpretation.
Tools and Software for Computing Fourier Transforms
Modern open-source libraries have democratized access to these advanced mathematical operations, allowing researchers to perform complex analyses with only a few lines of code. Platforms built specifically for data science offer optimized routines that handle large arrays and high-dimensional signals with ease. These tools facilitate the integration of spectral analysis into larger pipelines, including automated signal cleaning and classification tasks.
Specialized software designed for neurological or seismic data often includes pre-built modules for spectral decomposition and artifact removal. These packages handle the intricacies of frequency scaling and windowing automatically, reducing the risk of errors for researchers who may not have expertise in the underlying algorithms. Consistent use of these standardized tools also aids in the reproducibility of research results across different laboratories.
When choosing a software suite, compatibility with existing data formats and the ability to handle high-density sensor arrays remain the highest priorities. Documentation that provides clear examples of parameter tuning and algorithm selection is immensely useful for beginners. As the community continues to refine these tools, the focus increasingly shifts toward real-time edge processing and cloud-based scalability for very large datasets.
What Frequency Analysis Reveals About the Brain’s Hidden Rhythms
The Fourier transform acts like a mathematical prism for brain signals, untangling overlapping rhythms into distinct frequency bands. This breakdown provides the essential vocabulary for describing brain states—from deep sleep to attentive focus—and makes sense of terms like alpha or delta waves. Without this reorganization, an EEG trace would remain an indecipherable squiggle, its hidden rhythms invisible.
The practical power emerges clearly in seizure detection, where frequency analysis distinguishes seizure activity from normal brain patterns with high accuracy. The transform’s assumption that a signal segment repeats perfectly is a mathematical convenience, not a biological fact, but careful selection of short, stable stretches keeps distortions manageable. The literature demonstrate that representing brain activity as a sum of rhythms—while not a literal model of how neurons fire—yields information that is both measurable and clinically useful.
References
Jansen, B. H., Bourne, J. R., & Ward, J. W. (1981). Spectral decomposition of EEG intervals using walsh and fourier transforms. IEEE Transactions on Biomedical Engineering, (12), 836-838. https://doi.org/10.1109/TBME.1981.324686
Vidyaratne, L. S., & Iftekharuddin, K. M. (2017). Real-time epileptic seizure detection using EEG. IEEE Transactions on Neural Systems and Rehabilitation Engineering, 25(11), 2146-2156. https://doi.org/10.1109/TNSRE.2017.2697920
Pachori, R. B. (2008). Discrimination between ictal and seizure‐free EEG signals using empirical mode decomposition. Journal of Electrical and Computer Engineering, 2008(1), 293056. https://doi.org/10.1155/2008/293056
Frequently Asked Questions
What does a raw EEG trace actually represent?
An EEG trace is a single line showing voltage changes over time, but it is actually the combined sum of many separate oscillatory processes happening simultaneously in the brain. Different fast and slow rhythms add together into one composite waveform, like multiple instruments blending into a single chord.
How does the Fourier transform analyze an EEG signal?
The Fourier transform reorganizes the exact same EEG data by describing it in terms of frequency content rather than voltage across time. It separates the mixed rhythmic components already present, acting like a prism that reveals the individual wavelengths within a beam of light.
Does the Fourier transform add new information to the EEG recording?
No, the transform is mathematically reversible and does not invent or discard any data. It simply changes the display by converting the signal into a set of sinusoidal frequencies, making the underlying rhythmic ingredients visible.
What is the key mathematical assumption when applying the Fourier transform to EEG?
The calculation mathematically treats the selected EEG segment as if it repeats infinitely in a perfect loop. This periodicity assumption simplifies the analysis but can introduce edge artifacts if the signal's start and end don't match smoothly.
Why is it valid to break down an irregular brainwave into smooth sine waves?
Fourier’s theorem shows that nearly any waveform can be reconstructed by adding together pure sine and cosine waves of specific frequencies, amplitudes, and phases. This mathematical representation works for analysis, even though neurons don't literally generate isolated, clean sine waves.
Why are frequency bands like alpha or delta important in EEG interpretation?
Once a signal is decomposed, its components map onto standard bands like delta or beta, which form the fundamental vocabulary for describing brain states. Any mention of power changes in a specific band relies entirely on this initial Fourier-based separation.
What evidence supports using Fourier analysis for detecting seizures?
Studies using Fourier-derived frequency features have shown a statistically significant difference between seizure and non-seizure brain signals. One real-time detection system achieved high sensitivity, demonstrating that oscillatory information carries clinically relevant content for epilepsy.
What are the main limitations of this frequency-based approach?
The infinite repetition assumption is a structural simplification that becomes less accurate over longer, changing recordings. Additionally, the strong classification results come from specific datasets and do not prove the brain uses discrete sinusoidal oscillators as physiological structures.
Emotiv is a neurotechnology leader helping advance neuroscience research through accessible EEG and brain data tools.
Medical Disclaimer: The information provided on this website is for educational and informational purposes only and is not intended as medical or health advice. This content may contain errors and should not be relied upon to make life-altering health, medical, or lifestyle choices. Always seek the advice of your physician or other qualified health provider with any questions you may have regarding a medical condition or treatment.
Christian Burgos