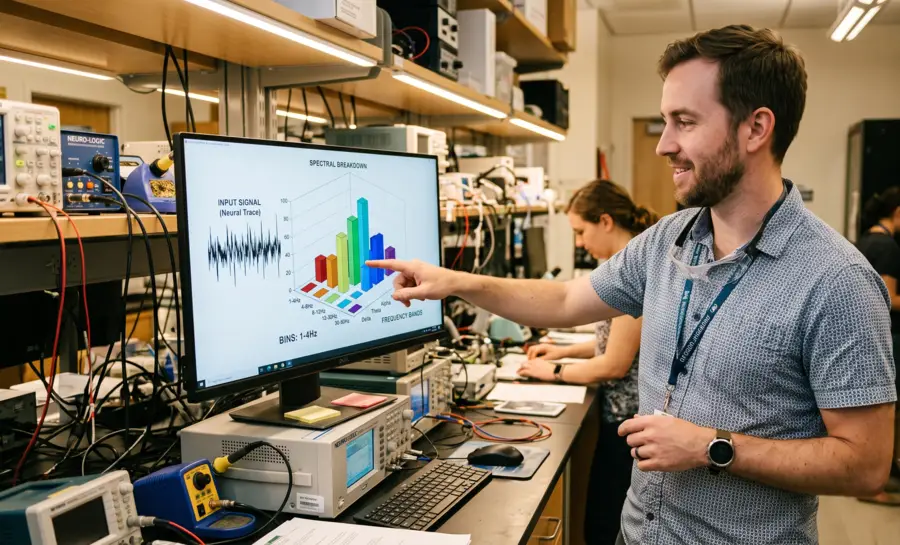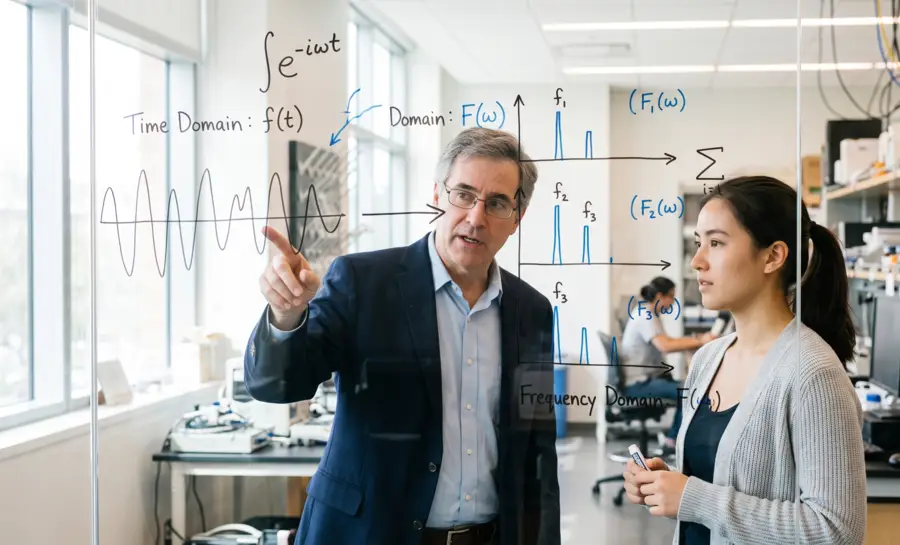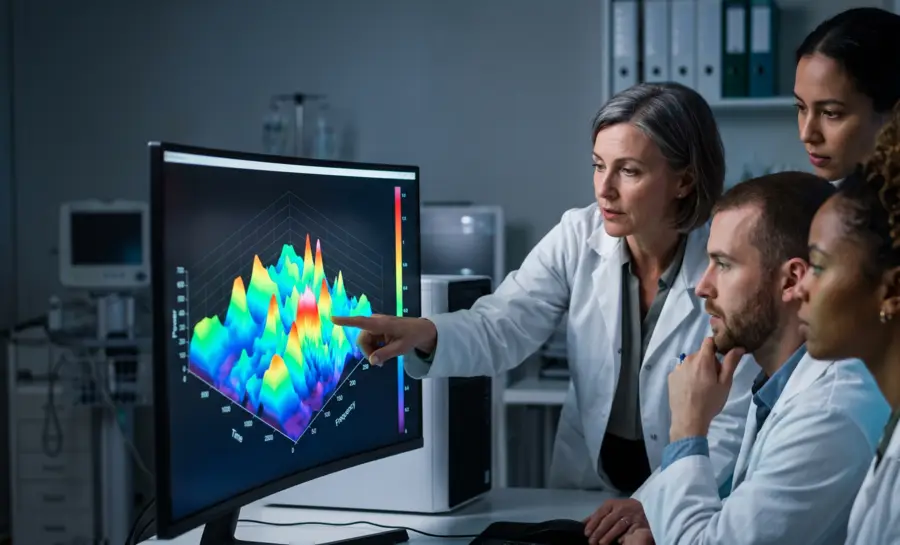
A basic Fourier Transform, the classic mathematical tool for breaking a signal into its component frequencies, can tell you which brain rhythms were present somewhere across an entire recording. What it cannot tell you is when they occurred. A short burst of alpha activity that appears the instant someone closes their eyes is a meaningful, time-locked event.
Averaged into a single frequency summary spanning a ten-minute recording, that burst becomes a statistic, indistinguishable from background noise. Recovering the timing of these events is the starting point for any serious EEG research, and it is the exact problem the Short-Time Fourier Transform (STFT) was built to solve.
The Problem with the Standard Fourier Transform
The standard Fourier transform is a pillar of classical signal processing because it effectively decomposes complex signals into a summation of pure sinusoids. By integrating over infinite time, it reveals the total frequency content present in a recording.
However, this method assumes the signal is stationary; if the frequency composition changes over time, the typical output obscures the temporal sequence. This limitation makes it impossible to distinguish between a short, bursty event and a sustained harmonic, which is vital in fields like neuroscience.
What Is the Short-Time Fourier Transform in EEG Analysis
The STFT approaches the timing problem with a fairly direct strategy. Instead of running a Fourier Transform on an entire EEG recording at once, it slices the signal into short, consecutive segments, often called windows, and applies the Fourier Transform separately to each one. Each window produces its own miniature frequency snapshot, and stitching these snapshots together in sequence creates a moving picture of how the frequency content changes over time.
The output of this process is usually displayed as a spectrogram, a visual map with time running along one axis and frequency along the other. The color or intensity at any given point on this map represents the power, or strength, of that frequency at that moment. This is precisely the value STFT analysis is designed to provide.
As Zabidi et al. puts it, STFT analysis works to “reveal the frequency contents of the EEG signals at each time point”.
Why Window Length Is the Most Important Setting in STFT
Slicing a signal into windows sounds simple, but the length chosen for each window determines almost everything about the quality and honesty of the resulting spectrogram. This decision involves a trade-off that cannot be avoided, only managed.
Think of it this way: a long window acts like a precise frequency ruler but a blurry stopwatch. Because it contains more data points, a long window can distinguish closely spaced frequencies with real accuracy. But because it stretches across a longer stretch of time, any event happening inside that window gets smeared out, and you lose the ability to pinpoint exactly when something changed.
A short window flips this trade-off. It acts like a precise stopwatch but a blurry frequency ruler. It can tell you almost exactly when something happened, but it struggles to separate frequencies that sit close together, because a short slice of signal simply does not contain enough oscillation cycles to measure frequency with fine detail.
This is a version of an uncertainty principle that governs all time-frequency analysis: you cannot achieve perfect resolution in both time and frequency at the same moment. Improving one always comes at some cost to the other. Recognizing this trade-off, rather than trying to defeat it, is the core skill of working with STFT.
Because different EEG rhythms oscillate at very different speeds, no single window length works well for all of them. The following guidelines are starting practical heuristics drawn from how these rhythms usually behave:
Delta waves (roughly 0.5 to 4 Hz): These are the slowest brain rhythms, and a window needs to be long enough, often in the range of 1 to 2 seconds, to capture at least one complete cycle of the slowest wave being measured. A shorter window simply will not contain enough of the wave to characterize it.
Theta and alpha rhythms (roughly 4 to 13 Hz): An intermediate window, often around 500 milliseconds, tends to strike a workable balance. It is long enough to capture several oscillation cycles, which helps define the rhythm clearly, while still being short enough to track meaningful changes, such as the onset of an alpha burst when the eyes close.
Beta and gamma rhythms (above roughly 13 Hz): These faster rhythms move quickly, so a short window, often 250 milliseconds or less, becomes necessary to track their rapid dynamics. The cost here is a reduced ability to discriminate precisely between closely spaced frequencies within the higher gamma range, a direct consequence of the same trade-off described above.
How STFT Reveals Differences Between Real and Imagined Movement
The practical value of STFT becomes clearest in brain-computer interface (BCI) research, where the goal is to translate brain activity directly into control signals for a device.
A well-studied example involves comparing EEG recorded while a person imagines moving a hand against EEG recorded while imagining a foot movement, or comparing imagined actions against the real physical version of that action.
In these motor-related paradigms, a common target of analysis is a phenomenon called event-related desynchronization, or ERD, a drop in signal power within the mu and beta rhythm ranges over regions of the brain associated with movement. Because ERD is a specific, time-locked dip in power rather than a constant background feature, it is exactly the kind of event that a whole-recording frequency summary would erase and that a time-resolved spectrogram can capture.
Zabidi et al. research study applying STFT directly to this question, examined EEG collected during actual handwriting and during imagined handwriting. The signal was first passed through a bandpass filter restricting the analysis to the 8 to 30 Hz range, covering the alpha and beta rhythms most relevant to motor activity, before the STFT was computed with a tuned Hamming window.
The result was a direct, specific finding: “the frequency components of the EEG signals obtained from writing are the same as that obtained during imagined writing”.
In practical terms, the brain's electrical rhythm pattern during an imagined action closely resembled the pattern during the real physical action, a correlation that underlies much of the logic behind BCI systems that aim to detect intended movement without requiring any actual physical motion.
Using STFT to Build Images for Deep Learning Models
Beyond visual inspection, spectrograms generated by STFT have found a second life as a preprocessing step feeding into deep learning systems, and specifically into Convolutional Neural Networks (CNNs), a type of model originally built for recognizing patterns in images. Since a spectrogram is essentially a colored image showing power across time and frequency, researchers believe that it can be handed directly to an image-based deep learning model, which may then detect hidden structure in the data that is difficult to specify by hand.
One 2019 study transformed EEG recordings from a motor imagery task, distinguishing right hand from right foot movement, into images using both STFT and an alternative time-frequency approach, then fed both sets of images into a pre-trained CNN architecture.
The performance across both approaches was strong, with the overall pipeline reaching 99.35% classification accuracy, described as the best score among existing comparable methods. However, when the two image-generation methods were compared directly against each other within that same study, the results were not equal: “the CWT approach yields better results than the STFT approach”, pointing to a real, measured trade-off in how faithfully each method translated the underlying EEG signal into a usable image.
This trade-off was reportedly the motivating problem behind a separate methodological development. Researchers built what they called anchored-STFT, described as “an advanced version of STFT, as it minimizes the trade-off between temporal and spectral resolution presented by STFT”.
Paired with an adversarial data augmentation method, this enhanced pipeline reported classification accuracies ranging from about 69% to over 90% across several BCI datasets, reinforcing the pattern that plain STFT can serve as a genuinely capable feature extraction tool, but one whose known resolution limitations create room for refinement, whether through parameter tuning, an enhanced version of the technique itself, or an entirely different time-frequency approach.
When STFT Falls Short: The Fixed-Resolution Problem
The trade-off discussed above is the central limitation that any researcher using STFT needs to weigh critically before drawing conclusions from a spectrogram.
Once a window length is chosen, say 500 milliseconds, that same window is applied uniformly across the entire frequency spectrum being analyzed, whether the researcher is looking at slow 2 Hz delta activity or fast 100 Hz gamma activity. The window does not adjust itself. The time-frequency trade-off described earlier is locked in at a single setting for the whole analysis, even though different rhythms would ideally benefit from different settings.
This fixed nature is precisely what separates STFT from a category of adaptive techniques, such as wavelet-based methods. Rather than locking in one window size for every frequency, adaptive methods effectively use longer windows for lower frequencies and shorter windows for higher frequencies, adjusting resolution as needed within a single analysis rather than committing to one compromise for the whole signal.
For instance, a study led by Wang et al. developing an adaptive time-frequency method reported that its approach “can provide optimal time-frequency resolution as compared to STFT and CWT”, explicitly naming STFT as the baseline being outperformed.
In a separate clinical application predicting antidepressant treatment outcomes in Major Depressive Disorder from pretreatment EEG data, researchers compared a wavelet-based approach directly against STFT and another decomposition method, and reported that “the WT analysis has shown highest classification accuracy” among the compared techniques, reaching 87.5% accuracy compared to the alternatives.
A Step-by-Step Workflow for Generating and Evaluating an EEG Spectrogram
Given these strengths and limitations, a disciplined workflow helps ensure that STFT is applied appropriately and its output is interpreted honestly.
Step 1: Define the question before touching the data. Is the goal to detect a rapid, brief gamma burst, or to track a slow drift in delta power over minutes? The answer determines which end of the window-length trade-off matters most.
Step 2: Select an initial window length matched to the target rhythm. Use the practical guidelines above as a starting point, longer windows for delta, intermediate windows for theta and alpha, shorter windows for beta and gamma. Pair this with an overlapping window scheme, commonly somewhere between 50% and 90% overlap between consecutive windows, which smooths the resulting spectrogram and reduces the appearance of artificial gaps between time slices.
Step 3: Generate the spectrogram and inspect it critically. Does the chosen window length show a clear, sharp onset for a fast rhythm of interest, or does the event look smeared across a wider stretch of time than it should? Can the spectrogram cleanly distinguish an alpha peak from a neighboring theta peak, or do the two rhythms bleed into each other? These visual checks are a direct, practical test of whether the chosen window length was appropriate for the data.
Step 4: Treat the result as one view among several possible views, not a final verdict. A negative finding, such as no measurable gamma difference between two experimental groups, could reflect a genuine absence of effect, or it could simply reflect the resolution limits of the specific STFT window chosen. A reasonable next step for confirming an ambiguous or important finding is to re-analyze the same data using an adaptive method as a cross-check.
Why Tracking When Brain Rhythms Fire Unlocks New Insights
Brain activity is a sequence of timed events, and recovering that timing turns a flat recording into a real-time account of shifting mental states. By moving from a single frequency summary to a moment-by-moment map, researchers can connect specific thoughts, intentions, or sensations directly to the brain rhythms that accompany them. This shift is what transforms EEG from a static measurement into a tool that can support brain-computer interfaces and feed into deep learning models that learn to recognize mental patterns.
The method’s fixed-resolution trade-off carries a broader lesson: every analytical choice highlights some truths while potentially blurring others, so no single result tells the whole story. This calls for cross-checking with other approaches when findings matter, and it reinforces that the brain’s electrical patterns—like the close match seen between imagined and actual movement—are deeply layered. That underlying similarity supports the idea that the brain rehearses actions using many of the same rhythmic signatures it uses to perform them.
References
Zabidi, A., Mansor, W., Lee, Y. K., & Fadzal, C. C. W. (2012, September). Short-time Fourier Transform analysis of EEG signal generated during imagined writing. In 2012 international conference on system engineering and technology (ICSET) (pp. 1-4). IEEE. https://doi.org/10.1109/ICSEngT.2012.6339284
Chaudhary, S., Taran, S., Bajaj, V., & Sengur, A. (2019). Convolutional neural network based approach towards motor imagery tasks EEG signals classification. IEEE Sensors Journal, 19(12), 4494-4500. https://doi.org/10.1109/JSEN.2019.2899645
Ali, O., Saif-ur-Rehman, M., Dyck, S., Glasmachers, T., Iossifidis, I., & Klaes, C. (2022). Enhancing the decoding accuracy of EEG signals by the introduction of anchored-STFT and adversarial data augmentation method. Scientific reports, 12(1), 4245. https://doi.org/10.1038/s41598-022-07992-w
Wang, Y., Veluvolu, K. C., & Lee, M. (2013). Time-frequency analysis of band-limited EEG with BMFLC and Kalman filter for BCI applications. Journal of neuroengineering and rehabilitation, 10, 109. https://doi.org/10.1186/1743-0003-10-109
Mumtaz, W., Xia, L., Yasin, M. A. M., Ali, S. S. A., & Malik, A. S. (2017). A wavelet-based technique to predict treatment outcome for Major Depressive Disorder. PloS one, 12(2), e0171409-e0171409. https://doi.org/10.1371/journal.pone.0171409
Frequently Asked Questions
What is the Short-Time Fourier Transform in EEG analysis?
The Short-Time Fourier Transform (STFT) slices the raw EEG signal into short, consecutive time windows and computes a frequency spectrum for each one. Stacking these snapshots in order creates a moving picture, called a spectrogram, that shows how the power of different brain rhythms changes from moment to moment.
Why can’t I just use a regular Fourier Transform on an EEG recording?
A basic Fourier Transform breaks the entire recording into its component frequencies but erases all timing information, so you know which rhythms were present overall but not when they appeared. The STFT recovers that timing by analyzing short segments separately, letting you see when a burst of alpha or a dip in beta power actually occurred.
What does a spectrogram show?
A spectrogram is a visual map with time on one axis, frequency on the other, and color or brightness representing the power of each frequency at that instant. It turns EEG from a flat summary into something like a musical score of the brain’s electrical activity.
Why does the window length matter so much?
Longer windows give precise frequency information but blur the exact timing of events, while shorter windows pinpoint timing well but smudge closely spaced frequencies together. This unavoidable trade-off means the choice of window length directly shapes what a spectrogram can reveal and what it will hide.
What window lengths are a good starting point for different brain rhythms?
For very slow delta rhythms, a longer window around one to two seconds is needed to capture full cycles. Theta and alpha rhythms are often well-served by a window around half a second, and faster beta and gamma rhythms require shorter windows of around a quarter second or less to track their rapid changes.
How can STFT reveal similarities between real and imagined movement?
STFT captures time-locked drops in power called event-related desynchronization in the mu and beta bands, which occur both when a person moves and when they mentally imagine the same movement. Spectrograms of real and imagined motor tasks can show nearly identical frequency patterns, supporting the logic of brain-computer interfaces.
Can STFT be used with deep learning models?
Yes, the spectrogram images generated by STFT can be fed directly into convolutional neural networks designed for image recognition. These models can learn to distinguish brain states from the time-frequency patterns, often achieving very high classification accuracy in tasks like motor-imagery detection.
What is the main limitation of STFT compared to other time-frequency methods?
STFT locks in a single window size for all frequencies, meaning it cannot give both sharp time detail for fast bursts and fine frequency detail for slow waves at the same time. Adaptive techniques such as wavelets vary the effective window length with frequency, which often leads to better resolution and higher classification performance in direct comparisons.
What is a good step-by-step approach when using STFT on EEG data?
Start by matching an initial window length to the rhythm you care about, use overlapping windows to smooth the spectrogram, and inspect the result to see whether events look sharply timed or smeared. If the finding is critical, consider cross-checking the data with an adaptive method because a single STFT setting may favor only one type of resolution.
Emotiv is a neurotechnology leader helping advance neuroscience research through accessible EEG and brain data tools.
Christian Burgos