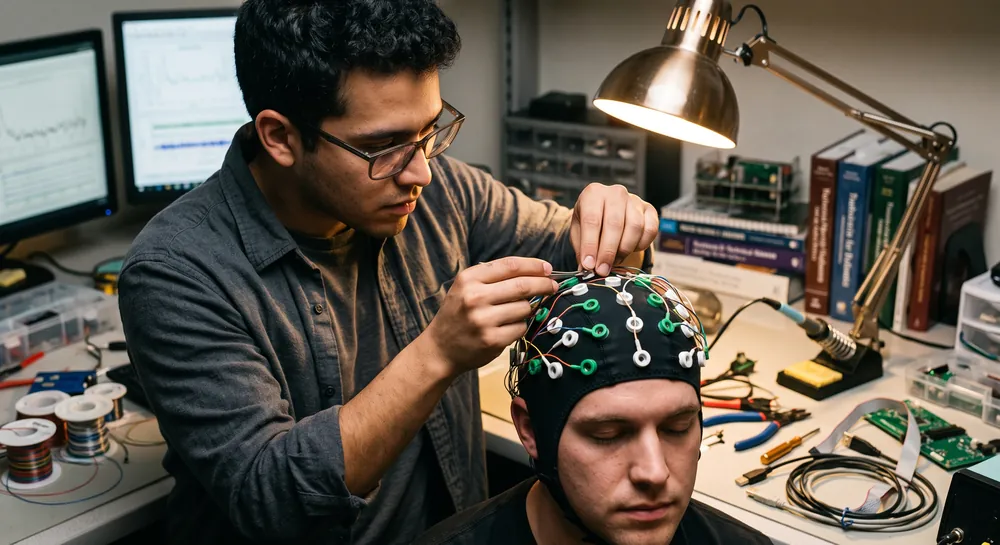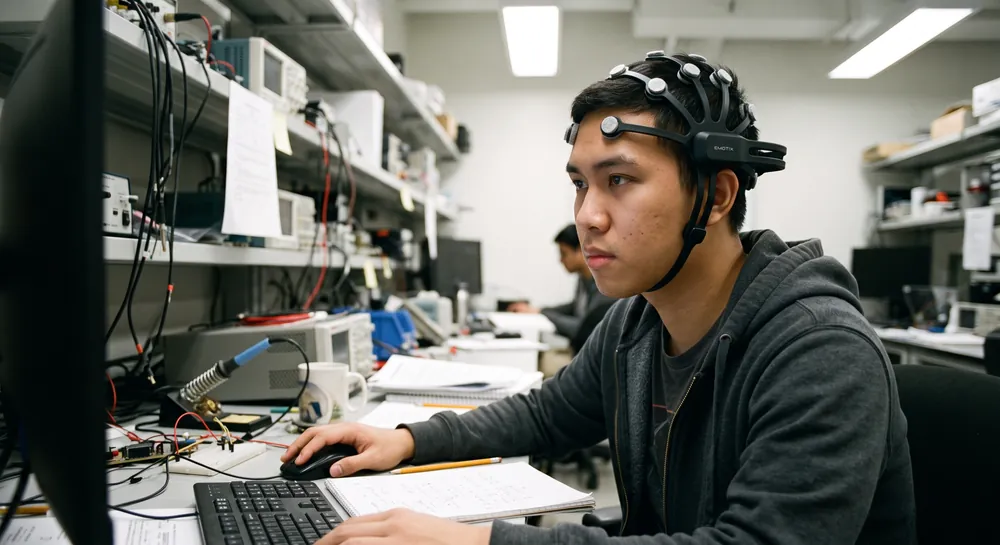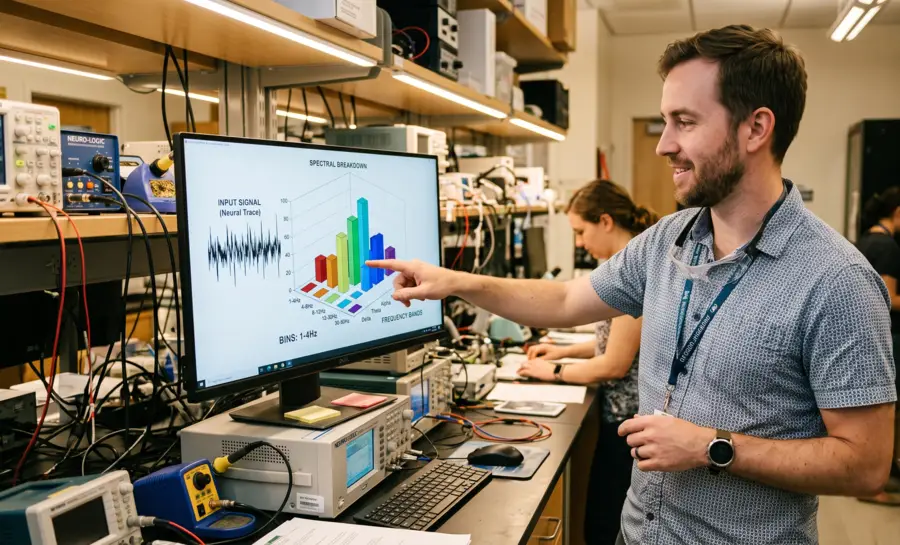
Neural oscillations are rhythmic patterns of electrical activity that support memory, movement, and sensory processing throughout the brain. Yet when these oscillations are captured on the scalp using electroencephalogram (EEG) recordings, they arrive buried inside a noisy, constantly shifting signal.
The raw voltage trace from any single electrode reflects the combined activity of thousands of neural sources layered on top of muscle activity, environmental interference, and background electrical noise. Pulling a clean oscillation out of that mixture requires a method that can split the recording into its frequency components.
Understanding Temporal Data and Frequencies
Temporal data exists as a continuous record of observations indexed by specific timestamps, reflecting how a system evolves over a designated duration.
In the context of neuroscience, this typically involves recording electrical potentials from the scalp to understand brain dynamics. These datasets are rarely static; they contain a blend of rhythmic signals and stochastic fluctuations that require careful interpretation to extract actionable insights.
What is Temporal Data?
Temporal data, or time series data, represents measurements taken sequentially at consistent intervals. The utility of this data depends on its sampling frequency and the length of the observation window, which determine the resolution of detectable changes.
Researchers examine these sequences to evaluate system stability and identify trends that persist over long durations.
The Concept of Frequencies in Data
Frequencies refer to the rate at which periodic patterns recur within a time series, usually measured in cycles per second. By evaluating these rhythms, analysts can categorize the underlying processes driving the data.
The following list outlines key frequency bands often observed in human biological monitoring applications:
Delta waves: Typically associated with deep, restorative sleep stages.
Theta waves: Frequently observed during light sleep or meditative states.
Alpha waves: Characteristically prevalent during quiet, wakeful relaxation.
Beta waves: Often linked to active cognitive concentration and alertness.
Gamma waves: Associated with high-level processing and integration tasks.
This classification allows precise mapping of states, helping investigators distinguish between physiological markers and background variability.
Why Decompose Temporal Data into Frequencies?
Decomposition acts as an analytical lens, separating a raw, noisy signal into distinct component parts. Without this structural breakdown, complex interactions between different brain rhythms remain buried in the aggregate amplitude. By isolating these components, researchers can analyze specific neural oscillations independently, revealing the true complexity of cognitive states.
Identifying Patterns and Cycles
Pattern recognition within temporal data allows for the identification of consistent neural cycles that repeat under specific stimuli or tasks. Identifying these cycles provides baseline metrics that differentiate healthy brain activity from deviant patterns.
Once a pattern is isolated through decomposition, it becomes possible to track its appearance and duration with higher statistical confidence.
Noise Reduction and Signal Enhancement
Effective signal processing is essential for removing environmental artifacts, such as 60Hz power line interference, from physiological records. By defining the frequency boundaries of legitimate biological data, researchers apply filters to eliminate unwanted signal components.
This signal extraction process fundamentally strengthens the clarity of the underlying data for further diagnostic review.
Forecasting and Predictive Modeling
Predictive models leverage decomposed segments to anticipate system shifts or event triggers before they manifest in full amplitude. These models rely on the stability of identified frequency components to project future evolution of the time series.
This capability supports both proactive clinical monitoring and experimental research into long-term brain plasticity.
Key Techniques for Temporal Data Decomposition
Decomposition requires mathematical rigour to ensure that the transformed data remains representative of the original neural activity.
Several established methodologies provide unique advantages depending on the resolution and stability of the captured signals. Selecting an appropriate tool requires balancing computational demand with the necessity for both temporal and spectral precision.
Fourier Transform Methods
Fourier analysis serves as a foundational approach for mapping time-domain signals into their frequency-domain equivalents. This method excels at identifying stationary frequency components, though it faces limits when analyzing transient signals that change over time.
The following table provides a comparison of major decomposition techniques applied in current research environments:
Technique | Primary Strength | Limitation |
|---|---|---|
Fourier Transform | High frequency precision | Poor temporal localization |
Wavelet Transform | Time-frequency balance | Computational complexity |
Singular Spectrum Analysis | Data-driven decomposition | Sensitivity to noise |
Wavelet Transforms
Wavelet transforms provide a multi-resolution analysis by dilating and shifting a mother wavelet to scan the signal.
Unlike Fourier methods, this approach maintains localized information in both time and frequency, making it suitable for capturing transient electrical spikes common in EEG measurement. This adaptivity is vital for identifying non-stationary features that traditional spectral methods might overlook during rapid data transitions.
Singular Spectrum Analysis (SSA)
Singular Spectrum Analysis offers a non-parametric approach that decomposes a time series into trend, oscillatory, and noise components based on the structure of the data itself. By embedding the time series into a multidimensional space and performing singular value decomposition, SSA extracts the most significant structural patterns.
This allows for the refinement of signals even when the underlying generating process is unknown or highly non-linear.
How the Fourier Transform Breaks Down EEG Signals
The classical starting point for frequency analysis is the Fourier transform, a mathematical operation that decomposes a signal into a sum of sine waves at different frequencies.
In its pure mathematical form, the Fourier transform assumes an infinite signal whose statistical properties never change, a condition that real EEG recordings never meet. In practice, researchers work around this by applying the discrete Fourier transform (DFT) to short, windowed segments of the recording, typically a few seconds long, and using the result to estimate power spectral density (PSD), which quantifies how much signal power exists at each frequency within that window.
This workaround comes with two core assumptions:
First, the signal is treated as if it were stationary for the duration of the chosen window, meaning its frequency content is assumed not to change within that slice of time.
Second, the signal is modeled as a linear sum of fixed sine waves, an approximation that works well for smooth, periodic activity but struggles with sudden shifts or non-sinusoidal shapes.
Despite these simplifications, PSD-based approaches have repeatedly proven useful in practice.
For instance, a comparative analysis of spectral feature extraction methods for motor imagery classification found that PSD techniques were the most consistently robust and effective at extracting distinctive spectral patterns for telling apart left-hand from right-hand movement imagery, evaluated across eleven subjects over two recording sessions.
Additionally, a separate study focused on drowsiness detection reinforces this pattern. Using a single EEG channel, researchers built a feature set combining PSD measures, including central frequency, the frequency below which a quarter of spectral power falls, total spectral energy, and power within the theta and alpha bands, alongside wavelet-based features.
This combined approach detected drowsiness episodes with 86.5 percent accuracy and alertness segments with 81.7 percent accuracy. The PSD component of that feature set was tracking gross, state-dependent shifts in spectral content, the kind of broad transition between mental states rather than a millisecond-by-millisecond oscillatory event.
Together, these two studies indicate that PSD estimation, despite its stationarity assumption, is capable of capturing meaningful spectral patterns tied to changing brain states, even when the signal generating those patterns is dynamic.
Empirical Mode Decomposition and Its Adaptive Alternative
Empirical Mode Decomposition (EMD) takes a different approach entirely. Rather than forcing a signal into a predefined basis of sine waves, EMD adaptively sifts the signal itself into a set of components called intrinsic mode functions (IMFs).
Each IMF is extracted directly from the data's own oscillatory structure, which in principle allows the method to follow instantaneous changes in amplitude and frequency without requiring the signal to sit still statistically.
Noteworthy, EMD also carries known drawbacks, including a tendency toward mode mixing, where a single IMF ends up containing oscillations from more than one true frequency band, and a sensitivity to noise that can distort the decomposition.
A related technique, Variational Mode Decomposition (VMD), was developed partly to address these instability issues. VMD extracts band-limited modes, each centered on a specific frequency, using a more constrained mathematical formulation that tends to produce more stable results than standard EMD.
One 2019 research study applied VMD together with a measure called mode spectral entropy, which quantifies the irregularity of a given frequency mode, to detect epileptic seizure events in EEG recordings. After a preprocessing step that included principal component analysis for channel selection, the method achieved 98 to 100 percent accuracy on the Bonn EEG database. On the more challenging CHB-MIT dataset, it produced an average sensitivity of 88.55 percent, specificity of 94.86 percent, and accuracy of 72.92 percent.
This result demonstrates that mode-based decompositions can successfully handle highly non-stationary, transient neural events, since a seizure is by definition a sudden, short-lived departure from baseline brain activity.
Spatio-Spectral Decomposition Solves the Source-Mixing Problem
Spatio-spectral decomposition (SSD) is a linear decomposition method that works across the full sensor array, finding a spatial combination of channels that maximizes signal power at a target peak frequency while simultaneously minimizing power at the neighboring frequency bins on either side. The output is not just a cleaner spectrum but a pattern showing which electrode locations, and by extension roughly which underlying brain regions, contribute most to that specific oscillation.
Research introducing this method demonstrated that SSD could reliably extract oscillatory signals even when the signal-to-noise ratio was as low as 1 to 10, a demanding test given how much stronger the noise was than the signal of interest.
In head-to-head comparisons, SSD outperformed conventional approaches based on independent component analysis (ICA). When applied to real EEG data, SSD separated out components with spatial patterns matching central, sensorimotor locations as well as separate components matching occipito-parietal, posterior locations.
The Future of Temporal Data Decomposition
Advancements in computational power and machine learning algorithms are beginning to merge classical spectral decomposition with data-driven predictive architectures. These integrated systems promise to automate the extraction of biomarkers, allowing for real-time analysis of neural dynamics that previously required lengthy offline processing. The convergence of these methods will likely reduce the latency between data acquisition and clinical action, facilitating more responsive brain-computer interfaces.
Research is increasingly focused on developing quantum-enhanced spectral estimators that transcend the limitations inherent in classical windowing functions. By optimizing the bandwidth efficiency of wavelet sets, investigators hope to achieve super-resolution that could distinguish between overlapping cortical sources at the millimeter scale. This evolution points toward a future where signal monitoring becomes significantly more granular and accessible.
Standardization across global research laboratories remains a pivotal objective for the next decade of temporal data science. Establishing benchmarks for performance evaluation will ensure that technical advancements are reproducible and translatable into public health applications. As these methodologies stabilize, the gap between fundamental neuroscience research and practical diagnostic utility is expected to close substantially.
Conclusion
Technique decomposing temporal data into frequencies remains a vital discipline for deciphering the complexity of electrical signals in human physiology. By applying robust mathematical methods to extract meaningful patterns from noisy datasets, researchers improve their capacity to monitor stability and detect pathological shifts.
As these analytical frameworks continue to evolve, they will further enhance the precision of neurological research and the efficacy of subsequent clinical outcomes.
References
Herman, P., Prasad, G., McGinnity, T. M., & Coyle, D. (2008). Comparative analysis of spectral approaches to feature extraction for EEG-based motor imagery classification. IEEE Transactions on Neural Systems and Rehabilitation Engineering, 16(4), 317-326. https://doi.org/10.1109/TNSRE.2008.926694
Garces Correa, A., & Laciar Leber, E. (2010). An automatic detector of drowsiness based on spectral analysis and wavelet decomposition of EEG records. Annual International Conference of the IEEE Engineering in Medicine and Biology Society. IEEE Engineering in Medicine and Biology Society. Annual International Conference, 2010, 1405–1408. https://doi.org/10.1109/IEMBS.2010.5626721
Das, P., Manikandan, M. S., & Ramkumar, B. (2018, December). Detection of epileptic seizure event in EEG signals using variational mode decomposition and mode spectral entropy. In 2018 IEEE 13th International Conference on Industrial and Information Systems (ICIIS) (pp. 42-47). IEEE. https://doi.org/10.1109/ICIINFS.2018.8721426
Nikulin, V. V., Nolte, G., & Curio, G. (2011). A novel method for reliable and fast extraction of neuronal EEG/MEG oscillations on the basis of spatio-spectral decomposition. NeuroImage, 55(4), 1528-1535. https://doi.org/10.1016/j.neuroimage.2011.01.057
Frequently Asked Questions
What is the difference between time and frequency domains?
The time domain shows how a signal's amplitude changes over time, while the frequency domain displays how much of the signal resides within specific frequency bands.
Can temporal decomposition be performed in real-time?
Yes, modern digital signal processing hardware allows for the continuous calculation of frequency components, enabling real-time monitoring and feedback applications.
How is noise separated from actual brain activity?
Noise is typically isolated by identifying frequency bands outside of known neural activity ranges or by recognizing characteristic spatial or spectral signatures associated with environmental interference.
How does the Fourier transform extract frequency information from EEG?
The Fourier transform decomposes a signal into a sum of sine waves, assuming the signal is stationary within a short time window. Power spectral density (PSD) then measures how much power exists at each frequency, providing a snapshot of the oscillatory content.
How does Empirical Mode Decomposition (EMD) differ from Fourier analysis?
EMD adaptively sifts the signal into intrinsic mode functions without assuming stationarity, allowing it to track instantaneous frequency and amplitude changes. This makes it theoretically better suited for non-stationary rhythms like mu, though it can suffer from mode mixing.
When would you choose PSD over a mode decomposition method?
PSD is a robust choice when studying broad, repeatable spectral patterns across conditions, such as comparing motor imagery tasks. Its computational simplicity and established reliability for classifying mental states make it effective when precise timing of rapid changes is not critical.
Emotiv is a neurotechnology leader helping advance neuroscience research through accessible EEG and brain data tools.
Medical Disclaimer: The information provided on this website is for educational and informational purposes only and is not intended as medical or health advice. This content may contain errors and should not be relied upon to make life-altering health, medical, or lifestyle choices. Always seek the advice of your physician or other qualified health provider with any questions you may have regarding a medical condition or treatment.
Christian Burgos