Neuroscientists convert EEG signals from time to frequency to separate complex, overlapping brain rhythms into distinct, readable bands. This transformation acts like a prism, clarifying noisy raw data into meaningful patterns that reveal mental states, individual signatures, and clinical indicators. By reorganizing existing information, this shift enables accurate detection of phenomena like seizures and emotional states that are otherwise hidden in the time domain.
What is the Time-to-Frequency Transformation?
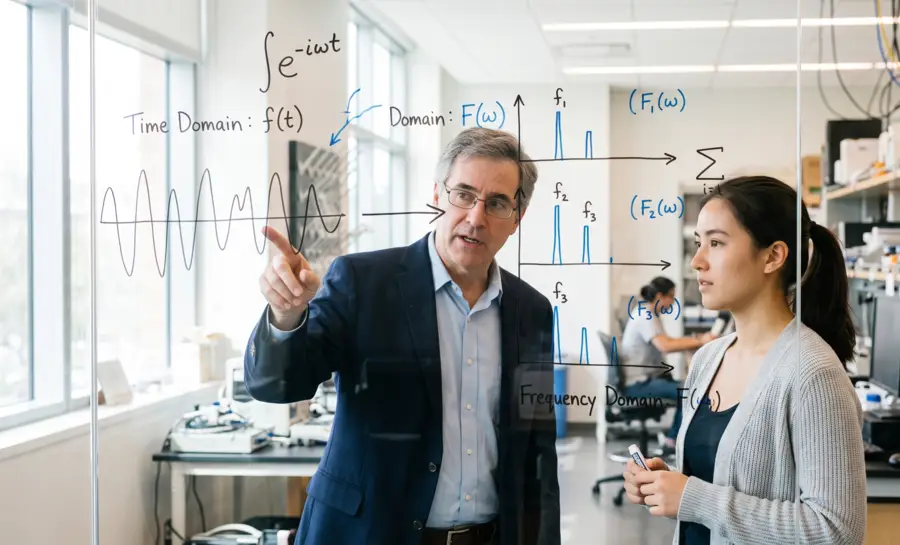
The transformation process involves converting raw data sequences, typically measured as amplitudes against time, into a spectrum of frequencies. This mathematical shift enables researchers to observe a signal's constituent rhythmic components rather than just the raw voltage or pressure fluctuations. By viewing data through this lens, subtle patterns within complex datasets become significantly easier to classify and interpret for further analysis.
Understanding the Basics: From Time Domain to Frequency Domain
In standard signal recording, the temporal aspect represents the sequence of events as they happen, maintaining a chronological order that is intuitive for immediate monitoring. However, many dynamic systems exhibit repetitive behaviors—such as the rhythmic firing of neurons associated with neuroscience—that are not easily teased apart by viewing the raw signal alone.
Shifting to a frequency perspective effectively acts as an analytical filter, allowing one to isolate individual rhythms and their relative contributions to the overall signal structure.
The Mathematical Foundation: Fourier Transform
The Fourier Transform operates on the principle that any complex oscillatory signal can be expressed as a weighted sum of simpler sine and cosine waves. This mathematical operation essentially performs a decomposition, extracting the underlying periodic structure of a signal regardless of its initial complexity.
By applying this transform, a researcher maps the temporal data points into a new domain where the horizontal axis represents frequency and the vertical axis indicates the power or amplitude of each specific frequency component.
Why is Time-to-Frequency Analysis Important?
Analyzing signals in the frequency domain is essential for isolating specific phenomena embedded within noise or larger, mixed waveforms. This approach is widely adopted across various fields that rely on accurate signal processing to extract relevant insights from sensors and measurement instruments.
Applications in Signal Processing
Engineers often encounter signals contaminated by background interference or ambient electrical noise, which can mask the primary information of interest. Analytical techniques that look at the frequency composition allow for precise filtering, whereby specific unwanted ranges are attenuated without disrupting the core data.
This capability is foundational for modern communication systems and sensor technologies, ensuring that valid signal peaks remain distinct and interpretable for downstream processing.
Insights in Audio and Speech Analysis
Human speech and natural sounds consist of multiple overlaid frequencies, each characterizing the timbre and tone of the underlying source. Converting these signals to the frequency domain lets researchers map out formants or detect speech characteristics that change with time, a frequent requirement in acoustics.
By treating these signals as spectrograms, analysts can monitor transient variations that might indicate specific sound artifacts or patterns that differentiate one acoustic source from another.
Use Cases in Biomedical Engineering
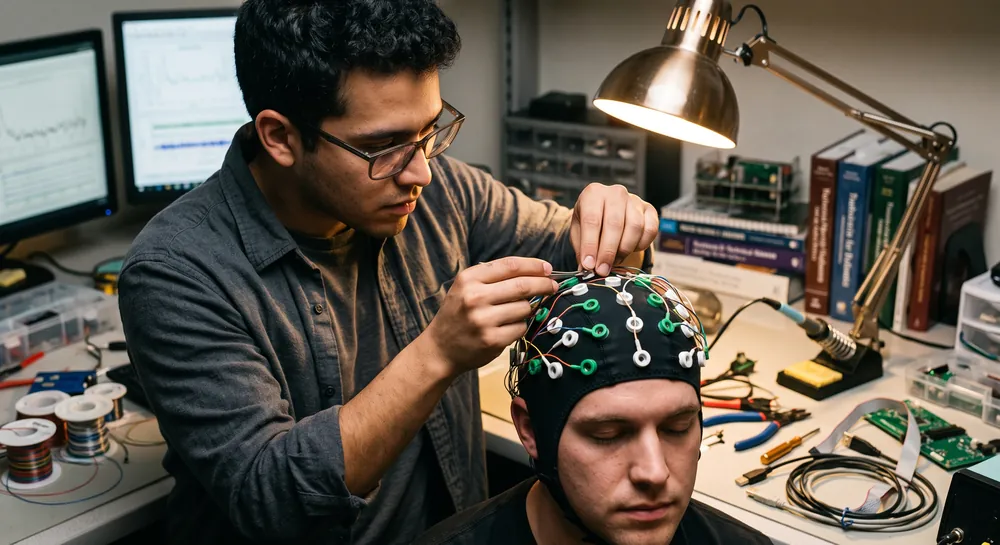
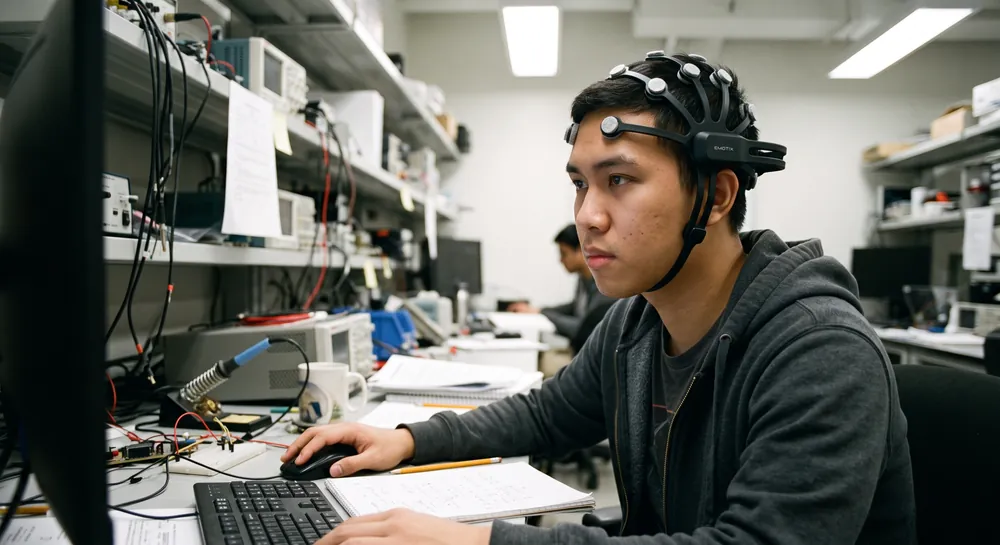
In medical settings, precise measurement of biological electrical output is critical for observing health and diagnosing neurological conditions. Using the EEG as a primary tool, doctors can record brain wave patterns while researchers use specific frequency analyses to study rhythmic behaviors associated with different states of alertness.
Integrating specialized equipment like the PCI Data Acquisition hardware ensures that high-fidelity data is captured, which is then processed through frequency-domain transforms to provide meaningful diagnostic insights.
Common Methods for Time to Frequency Conversion
Various algorithms exist for converting temporal data, each suited to different levels of signal stability and precision requirements. The selection of an appropriate method depends on the nature of the signal and the required resolution of the final spectral output.
Short-Time Fourier Transform (STFT)
This method segments a long signal into smaller, overlapping windows, performing a Fourier transform on each one to observe how frequency content evolves. It is particularly useful for signals that are not perfectly stationary but remain stable for short durations.
How to Convert Time to Frequency Manually
While software automates the bulk of the calculation, understanding the manual conversion of periodic signals requires identifying the cycle duration. By calculating the inverse of the period, one determines the rate at which the event completes a full cycle, resulting in the frequency value measured in Hertz.
Signal Type | Period (T) | Frequency (f) |
|---|---|---|
Slow Rhythm | 0.5 seconds | 2.0 Hz |
Mid-Range Oscillation | 0.1 seconds | 10.0 Hz |
Rapid Burst | 0.02 seconds | 50.0 Hz |
This table illustrates the inverse relationship between period and frequency, where a shorter cycle duration results in a significantly higher frequency output.
Using a Frequency to Time Calculator for Quick Estimates
Practitioners often use estimation tools to bridge the gap between time and frequency without exhaustive computation. These tools typically offer the following features for rapid configuration during data analysis:
Automatic conversion of cyclical time to hertz.
Support for multiple scale units like milliseconds and microseconds.
Instant flipping of functions to reverse the conversion.
Immediate graphing for visual comparison of signal stability.
These calculators provide an initial assessment before more complex digital filtering or spectral decomposition techniques are applied in a research environment.
Wavelet Transform
Unlike traditional Fourier approaches, the Wavelet Transform uses scalable windows to analyze both low and high-frequency components simultaneously. This allows for better localization of sudden signal changes, such as transient discharges or spikes that occur too quickly for windowed STFT analysis.
It is highly valued in fields that demand high temporal and frequency sensitivity in a single pass.
The Invisible Prism: Turning Time Into Frequency
A single moment of brain activity is rarely made of one clean wave. It behaves more like a musical chord, where several notes sound together to create one complex tone.
If you only listen to the chord as a whole, you hear a blend, not the individual notes. The same problem applies to a raw EEG trace. At any given instant, slow, medium, and fast oscillations are firing simultaneously, and the time domain view stacks them into a single, hard to parse waveform.
Converting that waveform into the frequency domain does not add new information to the signal. It reorganizes the existing information so the different oscillations become visible as separate components. This reorganization has measurable, practical consequences for how well researchers can clean noisy data and detect meaningful patterns.
Consider eye-blink artifacts, one of the most persistent sources of contamination in EEG recordings. When the eyes move, the resulting electrical signal, called the electrooculogram (EOG), leaks into nearby EEG channels and distorts the reading. Early correction attempts assumed the leakage from eyes to scalp behaved consistently across all rhythms, so a simple time domain subtraction should work equally well everywhere.
Kenemans et al. tested this assumption directly. Using both simulated and real data, researchers compared three cleanup strategies:
A simple time domain regression
A more complex multiple-lag time domain regression
A frequency domain regression.
When the eye-to-scalp electrical transfer was frequency-independent, meaning it behaved the same way across all rhythms, all three methods performed equally well. But when the transfer was frequency-dependent, meaning the contamination changed depending on which rhythm was involved, the simple time domain method failed to fully reconstruct the original EEG.
Only the frequency domain approach and the more sophisticated multiple-lag time domain method could account for that variability. This suggests that brain signal artifacts do not always behave uniformly across time, and sometimes only a frequency-aware lens can correctly separate true brain activity from contamination.
The payoff of this reframing becomes even more dramatic in seizure detection. A 2018 study found that when raw time domain EEG signals were fed into a classification system, accuracy on scalp recordings dropped as low as 60 percent in some experiments, a result not much better than a coin flip for certain classification tasks. When the same data was converted into the frequency domain first, accuracy on the same task jumped to roughly 96 percent.
The information required to correctly identify a seizure state was present in the recording the entire time. It simply was not visible until the signal was viewed through its frequency components.
Why the Frequency View Matters: From Noise to Life-Changing Applications
The shift from time to frequency is not an abstract technical preference. It has concrete consequences across four very different applications.
Sharper Artefact Removal
Eye movements and blinks are a chronic source of contamination in EEG recordings, since the electrical signal generated by the eyes can spread into nearby scalp electrodes.
The study by Kenemans et al. demonstrated that this contamination does not always transfer at a constant rate across all frequencies. When the transfer was frequency-dependent, a basic time domain correction underperformed, while a frequency domain regression method successfully reconstructed the original brain signal.
This is crucial for any application where clean signal quality is essential, since uncorrected eye artifacts can be mistaken for genuine brain activity if the wrong cleanup method is applied.
Your Brain, Your Signature
A study published in the Journal of Neural Engineering found that a person's overall pattern of brain rhythms remains remarkably stable across different recording sessions and even across different sensor placements on the scalp. This consistency, described as a form of EEG fingerprint, was strongest in the alpha band but detectable across a broad range from 1 to 40 Hz.
Notably, this identifying signature held up even when subjects were performing entirely different cognitive tasks, suggesting the pattern reflects something structurally stable about an individual's brain rather than something reactive to a specific mental activity in the moment.
The discriminative power of these rhythms followed what the researchers described as a W-shaped pattern across the frequency range, with the strongest identifying peak centered around the 10 Hz alpha rhythm. This finding has direct relevance for biometric identification systems that could one day use brain activity as a form of secure personal verification.
Reading Emotion
Emotional states leave measurable traces in brain rhythm patterns, and a study by Petrantonakis and his team shows these traces are best captured in the time-frequency domain rather than the raw time domain signal. By using an adaptive segmentation approach and measuring frontal alpha asymmetry, researchers built a classification system capable of distinguishing different combinations of valence and arousal, correctly classifying emotional states well above the level expected by random guessing.
This type of frequency-based emotion detection is associated with growing interest in brain-computer interfaces designed to respond to a user's mood or emotional engagement, though the reported classification accuracy, ranging from roughly 64 to 83 percent depending on the specific emotional categories tested, indicates this remains a probabilistic tool rather than a definitive emotional readout.
Conquering Epilepsy
Perhaps the most striking demonstration of the frequency domain's practical value comes from epilepsy research. The aforementioned 2018 research study directly compared time domain and frequency domain signals as inputs into a convolutional neural network tasked with distinguishing ictal, preictal, and interictal brain states.
On the intracranial Freiburg database, frequency domain input produced average accuracies between 92 and 97 percent across three separate classification experiments, while time domain input on the same database produced accuracies ranging from about 84 to 91 percent. The gap widened considerably on the scalp-recorded CHB-MIT database, where frequency domain accuracy stayed high, between roughly 93 and 98 percent, while time domain accuracy collapsed to a range of only 48 to 62 percent in some experiments.
This suggests that for certain recording conditions, particularly scalp EEG, the raw time domain signal may simply lack the resolvable structure needed for reliable automated seizure classification, while the frequency domain reorganization of that same signal makes the underlying pattern accessible to a machine-learning system.
Furthermore, Madhavan et al. pushes this concept further by focusing specifically on localization rather than detection in their 2020 study. Using a technique called synchrosqueezing transform to generate detailed time-frequency representations, combined with a deep convolutional neural network, the study achieved accuracy, sensitivity, and specificity values above 99 percent in distinguishing focal EEG signals, originating from the epileptogenic zone responsible for triggering seizures, from non-focal signals originating elsewhere in the brain.
This level of precision is directly relevant to epilepsy surgery, where correctly identifying the exact brain region responsible for seizure activity is a prerequisite for safe and effective surgical intervention.
A New Lens on the Living Brain
The transformation from a single voltage line wandering across time into a spectrum of distinct rhythms is the mechanism that makes the EEG readable in the first place. Without it, a seizure detection algorithm working from scalp data can perform barely better than chance.
With it, that same algorithm can climb into the mid-90s in accuracy. Without it, subtle eye-blink contamination can masquerade as genuine brain activity.
With frequency-aware correction, that contamination can be more reliably separated out. Without it, the stable, person-specific pattern within someone's brain rhythms, concentrated most strongly around the alpha band, remains invisible. With it, that pattern becomes a measurable signature.
None of these applications required new information to be added to the EEG signal. They required existing information to be reorganized into a form where meaningful patterns could finally be distinguished from noise.
That reorganization, the shift from time into frequency, is what turns a chaotic voltage trace into a structured record of delta, theta, alpha, beta, and gamma activity, giving researchers and clinicians a clearer, non-invasive way to study sleep, emotional states, individual identity, and neurological disease as they unfold in the living brain.
References
Kenemans, J. L., Molenaar, P. C., Verbaten, M. N., & Slangen, J. L. (1991). Removal of the ocular artifact from the EEG: a comparison of time and frequency domain methods with simulated and real data. Psychophysiology, 28(1), 114-121. https://doi.org/10.1111/j.1469-8986.1991.tb03397.x
Zhou, M., Tian, C., Cao, R., Wang, B., Niu, Y., Hu, T., ... & Xiang, J. (2018). Epileptic seizure detection based on EEG signals and CNN. Frontiers in neuroinformatics, 12, 95. https://doi.org/10.3389/fninf.2018.00095
DelPozo-Banos, M., Travieso, C. M., Weidemann, C. T., & Alonso, J. B. (2015). EEG biometric identification: a thorough exploration of the time-frequency domain. Journal of neural engineering, 12(5), 056019.
Petrantonakis, P. C., & Hadjileontiadis, L. J. (2012). Adaptive emotional information retrieval from EEG signals in the time-frequency domain. IEEE transactions on signal processing, 60(5), 2604-2616. https://doi.org/10.1109/TSP.2012.2187647
Madhavan, S., Tripathy, R. K., & Pachori, R. B. (2019). Time-frequency domain deep convolutional neural network for the classification of focal and non-focal EEG signals. IEEE Sensors Journal, 20(6), 3078-3086. https://doi.org/10.1109/JSEN.2019.2956072
Frequently Asked Questions
Why do neuroscientists convert EEG signals from time to frequency?
A raw EEG trace stacks multiple brain rhythms of different speeds into a single complex waveform, making individual patterns hard to see. Converting to the frequency domain splits that signal into separate component frequencies, like a prism separating white light into colors, so each rhythm can be studied on its own.
How does the frequency view improve eye-blink artifact removal?
Eye-blink contamination can transfer differently across EEG frequency bands, meaning a simple time-based subtraction often fails. A frequency-domain regression accounts for these frequency-dependent differences, allowing the true brain signal to be reconstructed more accurately.
What happens to seizure detection accuracy when using frequency domain instead of time domain?
Seizure-relevant patterns are present in the raw signal but invisible in the time domain. Frequency analysis reorganizes the data so that a classifier can achieve over 90% accuracy, whereas raw time-domain input sometimes performs no better than random guessing on scalp recordings.
Why is the alpha rhythm considered a strong biometric identifier?
Alpha activity shows a distinctive, stable peak around 10 Hz that remains consistent across different tasks and recording sessions. This stability reflects an individual’s underlying brain architecture, making it a reliable EEG fingerprint for person identification.
How can EEG frequency patterns indicate emotional states?
Frontal alpha asymmetry, which compares alpha strength between left and right frontal brain regions, differs with emotional valence and arousal. Frequency-domain analysis captures these asymmetry patterns, allowing classification of emotional states well above chance levels.
Why is frequency analysis essential for localizing seizure-onset zones in epilepsy surgery?
Brief, high-frequency gamma bursts and shifts across all bands mark the epileptogenic zone. Time-frequency techniques like synchrosqueezing transform these patterns into detailed representations, enabling deep-learning models to distinguish focal seizure signals from non-focal signals with very high precision—a prerequisite for safe surgical planning.
Emotiv is a neurotechnology leader helping advance neuroscience research through accessible EEG and brain data tools.
Medical Disclaimer: The information provided on this website is for educational and informational purposes only and is not intended as medical or health advice. This content may contain errors and should not be relied upon to make life-altering health, medical, or lifestyle choices. Always seek the advice of your physician or other qualified health provider with any questions you may have regarding a medical condition or treatment.
Christian Burgos