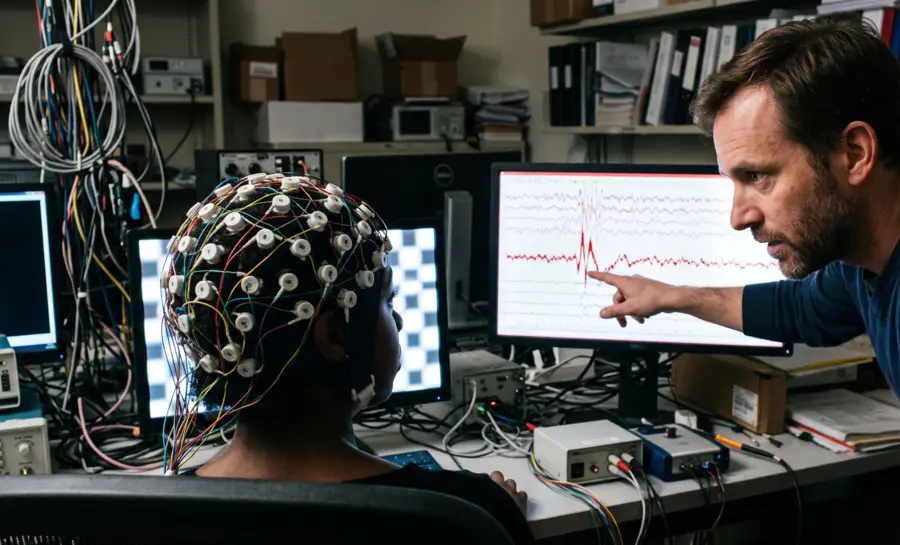
An event-related potential, or ERP, is a specialized method of analyzing standard EEG recordings, allowing researchers to track the electrical signature of cognitive processes with millisecond precision. This temporal accuracy makes the ERP uniquely valuable for answering a class of questions that spatial maps cannot touch:
When exactly does the brain detect a surprising stimulus?
At what moment does increasing memory load alter processing?
And how do neurological conditions shift the timing of these fundamental responses?
What Is Event-Related Potential (ERP)?
An ERP component is a reproducible deflection in the averaged waveform that researchers believe reflects a specific neural or cognitive operation. These components are typically named N for a negative deflection and P for a positive one, followed by either the approximate latency at which the component appears or its ordinal position in the waveform sequence.
Researchers quantify these components using three primary measures:
Amplitude: Reflects the size of the voltage deflection and is interpreted as a marker of the strength or extent of a particular cognitive process.
Latency: Refers to the timing of the peak and provides information about when a process occurs.
Scalp distribution: Offers clues about the underlying neural generators.
Changes in these measures allow researchers to make inferences about cognition. If an experimental manipulation causes a component’s amplitude to increase, the interpretation is often that the cognitive operation associated with that component becomes stronger or more extensive. If the latency shifts later in time, the cognitive process likely took longer to complete.
These relationships form the backbone of ERP research and allow the method to index cognitive functions ranging from early sensory detection to high-level semantic evaluation.
How ERP Signals Are Derived from EEG Data
A raw EEG recording captures a continuous stream of electrical activity from the brain, but this stream contains everything at once.
Ongoing neural oscillations, muscle movements, eye blinks, and environmental electrical noise all mix together into a complex signal. When a researcher wants to isolate the brain’s reaction to a specific event—a flash on a screen, the onset of a tone, a button press—the experimenter must extract that tiny, event-related signal from the background chaos.
The process begins with time-locking. At the exact moment a stimulus appears, the experimenter places a marker in the continuous EEG data.
The recording is then cut into fixed time segments called epochs, typically spanning several hundred milliseconds before and after the event. All of these epochs are aligned to the same moment the stimulus occurred. If a hundred identical tones play during an experiment, the researcher creates a hundred separate epochs, each aligned to the tone’s onset.
These aligned epochs are then averaged together. Researchers often look at brain activity that is consistently time-locked to the event that will occur at roughly the same moment in every epoch. When the epochs are combined, this consistent signal remains visible.
Background EEG activity, which is not time-locked to the event, appears at random points across trials and tends to cancel itself out during the averaging process. The resulting waveform displays time on the x-axis, measured in milliseconds, and voltage on the y-axis, measured in microvolts. The waveform contains characteristic positive and negative deflections that researchers can measure for their amplitude and latency.
This conventional averaging method, however, relies on a critical assumption. It presumes that the brain’s response is essentially identical from trial to trial and that any background EEG activity is random with respect to the event.
Real neural responses are rarely so tidy. Thus, averaging can obscure or distort this variability, presenting a smoothed picture that may not reflect the brain’s moment-to-moment dynamics with complete fidelity.
Common ERP Components (e.g., P300, N400)
Common component labels summarize recurring waveform features, but their interpretation depends on the task and recording context.
The P300 is often examined in relation to attention, stimulus evaluation, and the updating of a working representation, while the N400 is frequently studied when a stimulus creates a mismatch or difficulty in semantic processing. Other components, such as early sensory negativities or later response-related activity, can be used to examine perception and action.
A compact way to distinguish several frequently discussed components is to consider their usual timing and the processes they are commonly used to investigate:
Component | Typical timing | Common research focus | Interpretation caveat |
|---|---|---|---|
P300 | Around 300 ms | Attention and stimulus evaluation | Varies with task demands and probability |
N400 | Around 400 ms | Semantic access and integration | Sensitive to context, expectancy, and meaning |
N100/N1 | Around 100 ms | Early sensory processing | Strongly shaped by stimulus properties |
Error-related negativity | Shortly after an error | Response monitoring | Depends on task structure and error awareness |
ERP Signatures in Cognitive Neuroscience Research
ERP research has identified a family of components that serve as general markers of different processing stages:
Early components, often appearing within the first 100 to 200 milliseconds after a stimulus, are frequently linked to early attentional allocation or perceptual processing.
Later components, emerging several hundred milliseconds post-stimulus, are associated with higher-order cognitive functions such as updating expectations, evaluating meaning, and maintaining information during memory search.
A foundational study demonstrated how these components respond to the brain’s internal model of probability. When participants listened to sequences of high and low tones, the amplitude of the P300 and Slow Wave components showed an inverse relationship with a priori probability. Events that were less likely to occur produced larger responses. Noteworthy, sequential structure exerted an independent influence.
At every level of probability, a tone elicited a smaller response when it repeated the immediately preceding tone and a larger response when it represented a change. This finding suggests that the brain tracks both global probability and local sequential context using overlapping but separable mechanisms. In addition, the authors suggest that the P300 complex integrates multiple streams of contextual information to generate a graded neural response.
Moreover, in a semantic memory search task, participants matched word probes to category labels while researchers recorded their brain activity. Therein, Mecklinger et al. reported that as memory load increased, reaction time slowed and accuracy decreased.
Particularly, two ERP components showed a reciprocal relationship with the size of the memory set: P300 amplitude decreased while Negative Slow Wave amplitude increased. These two components emerged as distinct factors during statistical analysis, suggesting they index different aspects of the memory search process.
Additionally, the N400 component revealed sensitivity to semantic mismatch. Nontarget words that did not match the category label produced larger N400 responses than target words that did match, underscoring the component’s role in semantic evaluation.
Simultaneously, the theta band of the EEG, centered around 5 to 7 Hz, showed increased power as memory load grew heavier. This theta activity was functionally and topographically related to the Negative Slow Wave, a finding that points to a deep connection between time-domain ERP deflections and frequency-domain EEG oscillations.
Both measures appear to jointly reflect the difficulty of conceptual operations during memory search, bridging two analytical traditions that are often treated separately.
Single-Trial ERP Analysis vs. Traditional Averaging
Averaged ERPs can provide a clean but incomplete picture. They cannot show how attention fluctuated from one trial to the next, how response preparation varied, or whether a patient’s artifact-laden recording contained valid neural data beneath the noise. Single-trial analysis methods address these limitations by examining each epoch individually.
Independent component analysis, or ICA, offers a computational approach to disentangle mixed EEG signals that are statistically independent and non-Gaussian. This linear decomposition technique takes multichannel EEG data and separates it into statistically independent components, each arising from a distinct brain or extra-brain source.
When applied to ERP experiments, ICA can isolate blink artifacts, eye movement signals, temporal muscle activity, stimulus-locked brain responses, response-locked activity, and ongoing background EEG into separate components.
Furthermore, companion visualization tools such as the one described by Jung et al., can display single trials sorted by a behavioral or physiological variable, transforming what would otherwise be a chaotic stack of overlapping waveforms into an organized view of trial-to-trial variability. Changes in amplitude and latency across the sorted trials become immediately visible, revealing dynamics that the average waveform would conceal.
These combined techniques extend the ERP approach in several critical ways:
Artifacts of all types can be removed from single-trial data without rejecting entire epochs.
Stimulus-locked and response-locked components can be identified and separated, clarifying which neural activity is tied to stimulus processing and which is tied to response generation.
Differences in single-trial responses can be visualized and measured across conditions or participant groups.
When applied across subjects, ICA components representing blinks, eye movements, muscle activity, and event-related potentials show substantial replication, providing confidence that these decompositions capture genuine physiological sources.
Research Applications of ERP Methodology
The ERP method has proven broadly applicable across cognitive neuroscience, clinical research, and the study of learned brain self-regulation.
In healthy volunteers, neurofeedback protocols targeting specific EEG frequency bands have the potential to alter behavior and ERP measures in band-specific ways. For instance, Egner & Gruzelier found that operant enhancement of a 12 to 15 Hz component was associated with fewer commission errors and improved perceptual sensitivity on a continuous performance task. On the other hand, enhancement of a 15 to 18 Hz component showed the opposite behavioral pattern.
Both frequency enhancements, however, were associated with significantly increased P300 amplitude in an auditory oddball task. These associations point to band-specific effects on perceptual and motor aspects of attention, though they represent correlations rather than direct demonstrations of causality.
Another application is memory and semantic processing. When participants hold items in memory and search for matches, ERP components track the cognitive demands of the task with remarkable sensitivity.
Increasing the number of items held in memory decreases P300 amplitude and increases Negative Slow Wave amplitude. Reaction time slows and accuracy drops. Theta-band power rises in parallel with the Slow Wave, suggesting that these time-domain and frequency-domain measures share a common functional significance related to the difficulty of conceptual operations during search. The N400 component, as mentioned, differentiates semantic match from mismatch, providing a neurophysiological marker of meaning evaluation that unfolds within a few hundred milliseconds.
The brain’s sensitivity to probability and sequential context has also been established in early ERP work. The P300 and Slow Wave track a priori probability, with rarer events producing larger responses.
At the same time, the local sequential structure exerts a separate influence, with repeated stimuli producing smaller responses and alternations producing larger ones regardless of overall probability. These dual influences allow ERPs to serve as real-time indices of prediction, surprise, and the brain’s continuous updating of its internal context model.
Lastly, clinical research has applied ERPs to neurodegenerative conditions, yielding complex and sometimes counterintuitive findings. In nondemented patients with Parkinson’s disease, P3 amplitude was not reduced as might be expected. It increased.
However, this increase did not occur in isolation. N1 amplitude, post-stimulus mean amplitudes, and critically, resting EEG total power were also elevated. This means the heightened P3 amplitude in nondemented Parkinson’s disease doesn’t seem to be attributed solely to task-related processing, because the EEG shift was present even during a no-task resting condition with eyes closed.
As dementia increased in the patient sample, the pattern shifted. EEG power and ERP amplitudes decreased, and P3 latency lengthened.
Whether EEG power and P3 amplitude in nondemented patients can predict future cognitive decline remains an open question requiring prospective study.
What Are the Boundaries of ERP Interpretation?
ERP research offers millisecond-level insight into cognitive timing, but the method carries inherent limitations that must shape how findings are interpreted.
The conventional average waveform can conceal meaningful trial-to-trial variability. Single-trial methods using ICA and ERP image visualization address this limitation, but they introduce analytical complexity and demand careful interpretation. Components extracted by ICA are statistical constructs, and their physiological grounding requires validation across subjects and conditions.
Moreover, ERP effects are typically reported at the group level, and individual differences can be substantial. A group-average waveform with a clear P300 effect may not represent the response of any single participant with perfect fidelity.
Task specificity also constrains generalization. An ERP component that indexes memory load in a semantic search task may not behave identically in a working memory paradigm with different stimuli or response demands.
Further, the relationship between ERP measures and behavior is inherently correlational. Neurofeedback studies demonstrate that learned EEG changes and P300 amplitude shifts can co-occur with behavioral improvement, but these associations do not establish that the ERP change caused the performance gains.
Clinical ERP differences offer a particularly instructive example of this caution. In nondemented Parkinson’s disease, the increased P3 amplitude was accompanied by increased resting EEG power, suggesting that the ERP effect was embedded within a broader alteration of the brain’s electrical state, not a narrowly task-specific cognitive enhancement.
The Future of Event-Related Potential Research
Future ERP research is likely to place greater emphasis on trial-level variation rather than treating the average waveform as the only meaningful result. Single-trial methods can examine how attention, expectation, arousal, and prestimulus brain state influence responses from one event to the next. This may provide a more detailed account of neural dynamics while also demanding stronger statistical models and better quality control.
Improved equipment and analysis methods may support recordings in settings that are less constrained than traditional laboratories. More practical electrode systems, clearer event synchronization, and multimodal designs could connect EEG timing with behavior, eye movements, imaging, or peripheral physiology. Broader datasets and open analysis pipelines may also make cross-study comparisons more feasible.
The field will still face familiar limits. ERPs measure electrical consequences of coordinated neural activity at the scalp, not a direct readout of a single mental operation or an exact anatomical source. Progress will therefore depend on disciplined experimental design, preregistered analyses, transparent reporting, and cautious claims about diagnosis or cognition. These standards can make ERP research more cumulative without diminishing the method's distinctive temporal strengths.
Why Milliseconds Matter in Reading the Brain’s Electrical Signals
ERPs offer a view of cognition that purely spatial imaging cannot match, capturing the exact timing of how the brain reacts to surprise, context, or memory demands. By averaging time-locked EEG recordings, the method separates an authentic neural message from background electrical noise, revealing when mental operations take place and how their strength shifts under changing conditions. This timing-based perspective goes beyond showing where activity occurs, offering a chronological map of when the brain makes sense of its surroundings.
Equally instructive is what the data reveal about measurement limits, since single-trial signals are any single waveform not to tell the whole story. The methods show that valuable brain changes can be distributed, variable, and embedded within broader electrical activity rather than a single clean marker, and associations between brain measures and behavior remain tied to no absolute cause.
References
Bergmann, T. O., Mölle, M., Schmidt, M. A., Lindner, C., Marshall, L., Born, J., & Siebner, H. R. (2012). EEG-guided transcranial magnetic stimulation reveals rapid shifts in motor cortical excitability during the human sleep slow oscillation. The Journal of Neuroscience, 32(1), 243-253. https://doi.org/10.1111/j.1469-8986.1977.tb01312.x
Mecklinger, A., Kramer, A. F., & Strayer, D. L. (1992). Event related potentials and EEG components in a semantic memory search task. Psychophysiology, 29(1), 104-119. https://doi.org/10.1111/j.1469-8986.1992.tb02021.x
Makeig, S., & Westerfield, M. Analysis and visualization of single-trial event-related potentials. Human Brain Mapping, 14, 166-185. https://doi.org/10.1002/hbm.1050
Egner, T., & Gruzelier, J. H. (2001). Learned self-regulation of EEG frequency components affects attention and event-related brain potentials in humans. Neuroreport, 12(18), 4155-4159.
Frequently Asked Questions
What is an event-related potential (ERP) and how is it derived?
An event-related potential is a small voltage change in the EEG that is precisely time-locked to a sensory, cognitive, or motor event. It is derived by cutting the continuous EEG into epochs aligned to the event and averaging them, so consistent neural responses stand out while random background activity cancels out.
Why does averaging EEG epochs help isolate the brain’s response to an event?
Averaging works because brain activity that consistently occurs at the same time relative to the event remains visible, while random background EEG activity cancels out. This reveals a clean waveform with positive and negative deflections that researchers can measure for amplitude and latency.
What information do ERP amplitude and latency provide?
Amplitude reflects the strength or extent of a cognitive process, while latency indicates when that process occurs in time. Scalp distribution also helps infer which brain regions might generate the component.
How do ERPs measure the brain’s response to surprising or expected events?
The P300 and Slow Wave components show smaller responses to repeated or likely events and larger responses to changes or rare events. The brain tracks both global probability and local sequential context using separate but overlapping mechanisms within these components.
What is the role of the N400 component in language and semantic processing?
The N400 is sensitive to semantic mismatch, producing larger responses for words that do not match their context or category. It acts as a real-time marker of meaning evaluation, differentiating expected from unexpected semantic information within a few hundred milliseconds.
How do single-trial analysis methods overcome the limitations of traditional averaging?
Averaging can hide trial-to-trial variability, so single-trial methods like Independent Component Analysis and ERP images separate artifacts from neural sources and visualize changing responses. These techniques allow removal of blinks and muscle activity without rejecting entire epochs, and they reveal dynamic changes that group averages miss.
What is the relationship between ERP measures and brain oscillations like the theta band?
In memory tasks, increased memory load is associated with both larger Negative Slow Wave amplitude and higher frontal theta power. The two measures show functional and topographical similarities, suggesting they reflect shared difficulty in conceptual operations during memory search.
What are the main limitations of interpreting ERP results?
The conventional average waveform can mask meaningful trial-to-trial variability, and ERP effects are typically reported at the group level, which may not represent individual responses. ERP measures and behavior are correlated, not causal, and task specificity limits generalization across paradigms or clinical contexts.
Emotiv is a neurotechnology leader helping advance neuroscience research through accessible EEG and brain data tools.
Medical Disclaimer: The information provided on this website is for educational and informational purposes only and is not intended as medical or health advice. This content may contain errors and should not be relied upon to make life-altering health, medical, or lifestyle choices. Always seek the advice of your physician or other qualified health provider with any questions you may have regarding a medical condition or treatment.
Christian Burgos