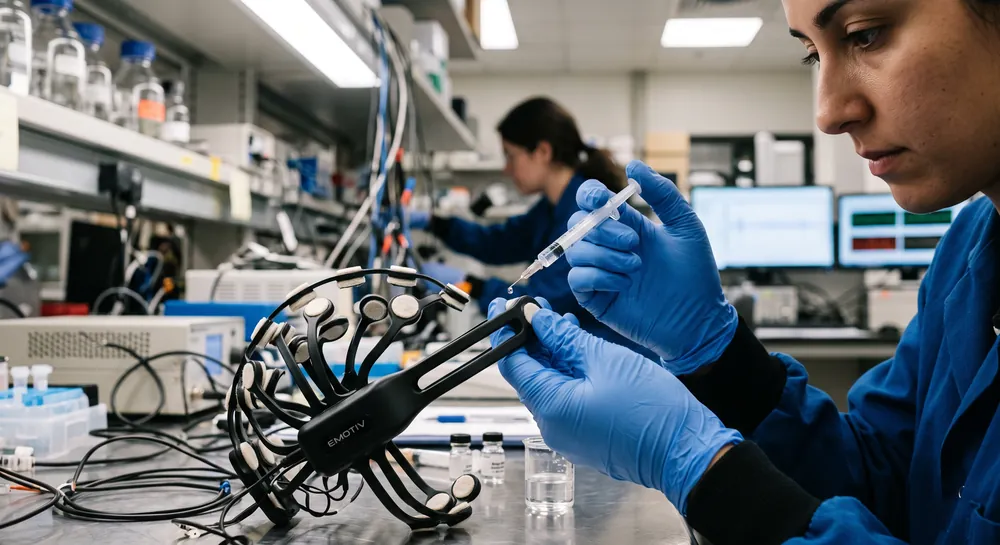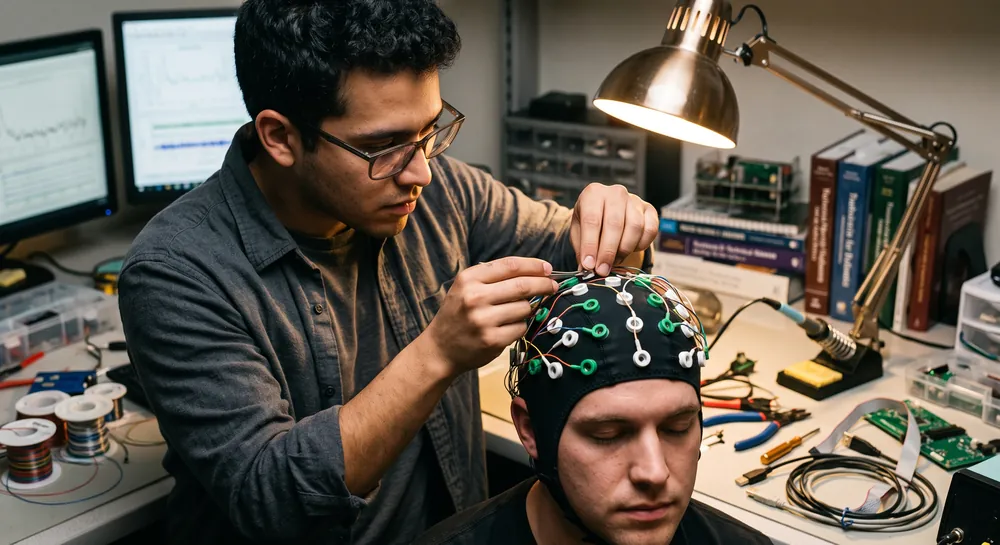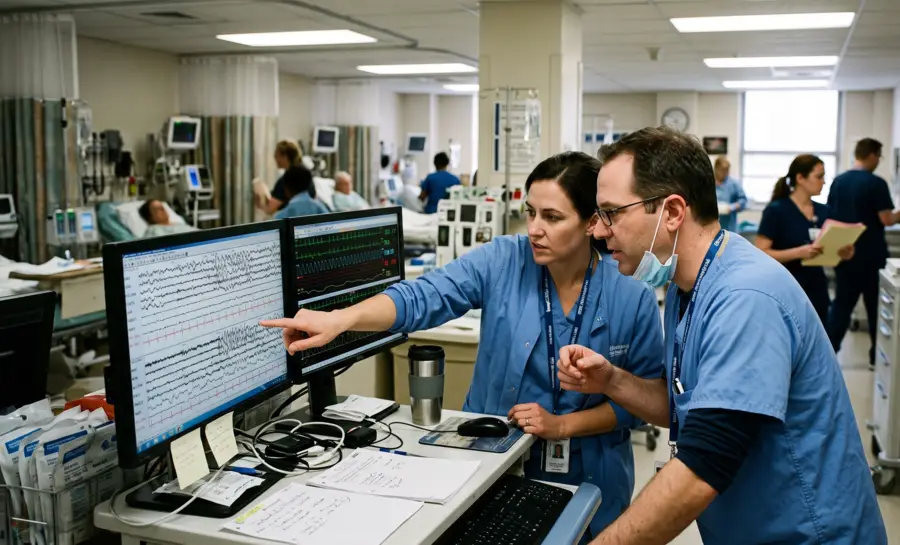
EEG data provides a time-sensitive record of electrical activity measured from the scalp. Its value depends not only on the recording itself, but also on careful acquisition, transparent processing, appropriate storage, and responsible interpretation.
What Is EEG Data?
EEG data is a digital record of voltage differences measured by electrodes placed on or near the scalp. Electroencephalography is noninvasive and offers high temporal resolution, allowing researchers and clinicians to examine changes in brain activity over milliseconds. The resulting signal is usually stored as one or more continuous time series, with each channel representing a measurement relative to a reference.
The signal reflects a mixture of sources. Neural activity contributes to the recording, but artifacts like eye movements, muscle contractions, electrode movement, environmental interference, and changes in contact can also appear in the trace.
For that reason, EEG data is not a direct readout of a single brain process. It is an observation that requires context, quality checks, and an explicit analytical method.
The number of channels, sampling rate, reference, electrode locations, event markers, and participant information all shape how the data can be interpreted. In practice, the recording is most informative when the signal is considered alongside the task, state, timing, and conditions under which it was collected.
How Brain Cells Generate the EEG Signal
The voltage deflections that an EEG electrode detects originate not from the sharp, all‑or‑nothing action potentials that neurons use for long‑range communication but from the slower, graded postsynaptic potentials that spread across the dendrites of cortical pyramidal cells.
When thousands of these neurons activate in approximate synchrony, their tiny extracellular currents summate through the conductive medium of the brain, cerebrospinal fluid, skull, and scalp, a process called volume conduction. The voltage that finally reaches the recording sensor is a blurred but real reflection of that large‑scale neural synchrony.
How EEG Data Acquisition Works
During acquisition, electrodes detect small voltage fluctuations and a recording system converts them into digital samples. The system typically records multiple channels simultaneously, while a reference and ground provide the electrical context needed to calculate channel values. Sampling rate determines how frequently the signal is measured and therefore which changes can be represented faithfully.
Before recording, technicians or researchers position the electrodes according to a defined montage and check contact quality. The EEG electrode placement framework describes a standardized approach that supports comparison across sessions and laboratories. Event markers may be added when a stimulus appears, a participant responds, or a clinical event occurs, creating a timeline that can later be aligned with the recorded signals.
Acquisition is also shaped by the protocol. Resting-state recordings, sleep studies, cognitive tasks, and seizure monitoring use different durations, instructions, and auxiliary sensors. A complete dataset therefore includes more than voltage traces: it may contain channel labels, electrode positions, device settings, event codes, annotations, and a record of interruptions or unusual conditions.
Best Practices for EEG Data Collection
Good collection begins with a protocol that defines the research question, recording duration, channel configuration, sampling rate, reference, and event-marking procedure before participants are tested. Consistency reduces unwanted variation between sessions and makes later comparisons more defensible. The protocol should also describe what happens when a channel is noisy, a participant moves, or an event marker is missed.
Physical preparation is also crucial because signal quality can deteriorate through ordinary movement and poor electrode contact. That’s why operators commonly inspect impedance or equivalent contact indicators, explain the task clearly, and record relevant changes in participant state. These steps do not remove every artifact, but they make its source easier to identify and prevent avoidable problems from being mistaken for neural findings.
A short collection checklist can keep operational details visible without replacing scientific judgment:
Confirm channel labels, electrode locations, reference, and ground.
Record sampling settings, filter settings, and device configuration.
Mark stimuli, responses, pauses, and clinically relevant events consistently.
Document interruptions, movement, electrode changes, and unusual participant states.
After collection, the checklist should be paired with an inspection of the raw recording and its metadata. Clear acquisition records allow analysts to distinguish a genuine signal feature from a change caused by hardware, setup, or protocol drift.
Wet vs. Dry Electrodes and Skin Contact Quality
All EEG recordings start with a physical sensor against the skin, and that sensor falls into one of two broad families.
Wet electrodes use a conductive gel or paste to bridge the gap between metal and scalp, lowering impedance. Dry electrodes eliminate the gel, relying on advanced materials and built‑in preamplification to maintain signal fidelity.
Some electrodes are active, meaning they contain impedance‑conversion circuitry directly at the recording site; passive electrodes lack this onboard electronics. Regardless of the type, the quality of the electrode‑scalp interface determines how much biological signal survives before it even reaches the amplifier.
Poor contact invites environmental noise and motion artifacts that can swamp the faint brain activity. Winkler et al. made this challenge explicit when they tackled the universal problem of artifactual source components by building a subject‑independent classifier for independent component analysis (ICA) components.
The very existence of that effort underscores that artifact contamination is a persistent issue in EEG recordings, and the initial application of electrodes—cleaning the skin, correctly placing the sensor, and verifying a stable connection—is the first, most direct way to lighten the artifact load that later processing must deal with.
Montage Design and the Standard 10–20 System
Because scalp potentials have no inherent spatial label, the field adopted a coordinate grid long ago. The international 10–20 system defines electrode positions proportionally between four anatomical landmarks: the nasion (bridge of the nose), the inion (bony bump at the back of the head), and the left and right pre‑auricular points just in front of the ears. This standardization means that a channel labelled “Cz” refers to the same central vertex location in every lab, making datasets directly comparable.
A montage defined as the specification of how each electrode’s voltage is measured relative to a reference and how those bipolar or referential derivations are displayed or stored, sits on top of that physical layout. Arnaud Delorme’s study is a strong illustration of why accurate montage information matters downstream by finding that bad‑channel interpolation, one of the few preprocessing steps that consistently improved the statistical power of event‑related potentials, depends on knowing the precise spatial neighbors of each electrode. Without a correct channel map, such interpolation cannot function reliably.
He then adds that the artifact classifier was designed to generalize to data that used different channel setups, reinforcing that the classifier’s spatial features assume a well‑documented arrangement. A standardised, faithfully noted montage thus becomes the invisible scaffold that supports both human interpretation and algorithmic reuse.
Choosing and Documenting the Online Reference
Every EEG amplifier records the difference in voltage between two points. During the online recording, one of those points is a physical reference electrode that the hardware treats as a fixed baseline.
Common choices are the vertex (Cz), linked earlobes or mastoid processes, or an average of all scalp channels. Because the raw data file stores voltages with respect to that original reference, the choice leaves a permanent imprint on the numbers, even if a researcher later mathematically re‑references the signal to another common point.
In the aforementioned study by Delorme, which tested automated preprocessing pipelines on three public EEG collections, he found that referencing and advanced baseline removal methods were significantly detrimental to performance, reducing the percentage of channels that showed a significant experimental effect.
That finding does not imply that one must never re‑reference, but it does mean that the initial online reference must be recorded in the file header. Only with that note can a future analyst understand what baseline was originally subtracted and assess whether any subsequent transform might distort the genuine brain response.
Analog‑to‑Digital Conversion and Sampling Rate
The continuous voltage that flows from each electrode is converted into a stream of discrete numbers by an analog‑to‑digital converter (ADC). The rate at which the ADC samples determines the temporal grain of the resulting time series.
A sampling rate of 500 Hz, for example, means that the brain’s electrical state is captured once every 2 milliseconds. According to the Nyquist theorem, the highest frequency that can be faithfully represented in the digitized signal is less than half the sampling rate, so a 500 Hz recording can recover frequencies up to just under 250 Hz. Research‑grade EEG usually operates between 250 Hz and 1000 Hz, depending on the frequency bands of interest.
What makes the sampling rate particularly important as metadata is that it quietly constrains analytical choices made far downstream. Fraschini et al. examined exactly this ripple effect by testing how epoch length—the time window of data extracted for connectivity analysis—shifts the outcomes.
Using resting‑state EEG from healthy adults, the study showed that mean phase‑lag index and amplitude‑envelope correlation values both decreased as epochs lengthened, stabilizing only after roughly 12 seconds and 6 seconds, respectively. Even the topology of graph‑theoretical networks reconstructed from the data varied with epoch duration, though source‑level minimum spanning tree parameters proved more robust.
The essential takeaway for raw data documentation is that the number of samples per second sets an absolute floor on how timing can be sliced. If the sampling rate is recorded incorrectly, every subsequent event marker, epoch boundary, and connectivity estimate inherits that error. Therefore, noting the exact ADC rate in the file header is a non‑negotiable piece of housekeeping.
Standard Data Storage Formats: EDF and BrainVision
Once digitized, the time series and its accompanying metadata must live in a file format that other software, and other laboratories, can open without ambiguity.
Two open formats dominate the field. The European Data Format (EDF) is a compact, widely adopted container common in sleep research and clinical settings that stores multiple channels alongside a header specifying the sampling rate, channel labels, and physical dimensions.
BrainVision, a format developed by Brain Products, spreads the same information across three linked files: a text header (.vhdr) that lists channel names, the sampling rate, and the original reference; a marker file (.vmrk) that records event codes and their latencies; and a binary data file (.eeg) that holds the raw voltage samples.
The value of these standardized formats crystallizes when large datasets are shared publicly. For instance, in a 2019 study, researchers released a multi‑paradigm brain‑computer interface (BCI) dataset covering motor imagery, event‑related potentials, and steady‑state visually evoked potentials from 54 participants. Distributing such a resource with open‑source analysis scripts would be meaningless if the data were locked in a proprietary wrapper.
Whether the files are ultimately archived in EDF or BrainVision, the choice guarantees that any researcher can download the recording and reproduce the findings, linking the raw trace to the entire community’s reproducibility chain.
Feature | EDF | BrainVision |
|---|---|---|
File structure | Single container | Three linked files |
Header info | Inside file | .vhdr text file |
Event markers | Not separate | .vmrk file |
Raw data | In same file | .eeg binary file |
Essential Housekeeping: Channel Maps and Sampling Metadata
A raw EEG file becomes scientifically usable only when it carries a complete, accurate description of its spatial and temporal scaffold. This means that every channel must have a standard label (i.e., Fz, C3, O2, and so on) along with its three‑dimensional coordinates on the scalp. Those coordinates allow any later analysis that involves spatial relationships, such as interpolating a bad channel from its neighbors or projecting the signal onto a cortical source model.
The study by Fraschini et al. relied on spatial, spectral, and temporal features to classify ICA components as brain or artifact; the spatial topography of a component is meaningless without knowing the physical location of each electrode that contributed to it.
Likewise, Delorme found that bad‑channel interpolation, which uses the values from adjacent electrodes, was one of the few corrections that reliably maintained experimental effects. An interpolator can only perform that spatial guess if the dataset’s channel map is correct.
The file header must also store the precise sampling rate, the date of the recording, and unambiguous labels for any auxiliary channels such as electro‑oculogram (eye movements) or electromyogram (muscle activity). Even if those channels will sit unused during initial data exploration, their presence should be transparent. A mismatch between the stored sampling rate and the actual ADC clock can warp timing irreversibly, making it impossible to align with stimulus markers later.
EEG Data in Clinical vs Research Settings
Clinical and research recordings share core principles but serve different immediate purposes. Clinical EEG is acquired to support patient assessment, monitoring, or diagnosis under established professional and institutional procedures. Research EEG is usually collected to test a defined hypothesis, compare conditions, or develop an analytical method, with study-specific protocols and documentation.
Clinical work places strong emphasis on timely review, clinically meaningful montages, validated interpretation, and a permanent record within the applicable care system. Research places greater emphasis on controlled conditions, prespecified outcomes, reproducibility, and transparent handling of exclusions. A research result is not automatically a clinical finding, and a clinical observation is not automatically a validated research measure.
The distinction also affects data governance. Clinical data may be governed by medical-record obligations and direct care requirements, whereas research datasets are shaped by consent language, institutional review, data-sharing plans, and study endpoints. In both settings, trained interpretation and careful documentation are necessary because EEG patterns depend on context rather than on isolated numerical values.
Privacy and Ethical Considerations for EEG Data
EEG recordings can be linked to a person through identifiers, session information, clinical context, or combinations of metadata. Even when the waveform itself is difficult to interpret outside a specialist setting, it should be handled as sensitive human-subject data when it is connected to an identifiable participant. Collection and reuse should be consistent with the approved protocol and applicable privacy requirements.
Consent should explain the purpose of recording, the kinds of analyses anticipated, storage duration, possible sharing, and whether future uses are permitted. Researchers should avoid implying that EEG can reveal more than the study is designed to measure. Clear communication is especially important when participants may assume that a research recording provides a diagnosis or individualized assessment.
Ethical practice continues after collection. De-identification, controlled access, retention limits, audit trails, and careful release of metadata help reduce risk, but no method eliminates it entirely. Findings should be reported without overstating predictive or diagnostic meaning, and automated classifications should be treated as analytical outputs requiring appropriate validation rather than as unquestionable judgments about a person.
Why Raw Recording Quality Sets the Foundation for Trustworthy EEG Analysis
A single EEG session is the moment the brain's electrical architecture is captured in permanent form, and the complexity of that raw trace already mirrors the neural networks beneath the scalp. The neuroscience-based studies highlighted here carry a unified message: the signal of interest lives in the raw data itself, provided the acquisition step is handled with care. Electrode contact quality, accurate channel mapping, documented references and sampling rates, and open storage formats all determine whether that signal remains accessible across laboratories and years.
Lastly, restraint often outperforms heavy processing as researchers who left raw data largely alone preserved genuine brain responses better than those who applied aggressive corrections. Careful recording, honest metadata, and minimal interference form a discipline that keeps the scientific signal intact.
Every trustworthy analysis therefore begins not with sophisticated algorithms but with the simple act of capturing a faithful, well-documented trace.
References
Winkler, I., Haufe, S., & Tangermann, M. (2011). Automatic classification of artifactual ICA-components for artifact removal in EEG signals. Behavioral and brain functions, 7(1), 30. https://doi.org/10.1186/1744-9081-7-30
Delorme, A. (2023). EEG is better left alone. Scientific reports, 13(1), 2372. https://doi.org/10.1038/s41598-023-27528-0
Fraschini, M., Demuru, M., Crobe, A., Marrosu, F., Stam, C. J., & Hillebrand, A. (2016). The effect of epoch length on estimated EEG functional connectivity and brain network organisation. Journal of neural engineering, 13(3), 036015.
Lee, M. H., Kwon, O. Y., Kim, Y. J., Kim, H. K., Lee, Y. E., Williamson, J., ... & Lee, S. W. (2019). EEG dataset and OpenBMI toolbox for three BCI paradigms: An investigation into BCI illiteracy. GigaScience, 8(5), giz002. https://doi.org/10.1093/gigascience/giz002
Frequently Asked Questions
What exactly does an EEG recording capture, and why is it considered a reflection of brain activity?
An EEG recording captures the tiny voltage fluctuations at the scalp that arise from the synchronized activity of large groups of cortical neurons. These fluctuations primarily come from graded postsynaptic potentials in pyramidal cells, which summate through volume conduction, creating a blurred yet real measure of large-scale neural synchrony.
Why do EEG signals originate from postsynaptic potentials rather than action potentials?
Action potentials are brief, all-or-nothing events that contribute little to the scalp voltage, whereas slower, graded postsynaptic potentials spread over dendrites and summate across thousands of neurons. This summation produces detectable voltage deflections at the scalp, making postsynaptic potentials the primary source of the EEG signal.
What is the difference between wet and dry electrodes, and how does electrode contact quality affect a recording?
Wet electrodes use a conductive gel to lower impedance and improve signal transfer, while dry electrodes rely on advanced materials and built-in preamplification to maintain fidelity without gel. The quality of the electrode-skin interface is critical because poor contact invites environmental noise and motion artifacts that can overwhelm the faint brain signal.
How does the international 10–20 system standardize electrode placement, and why is it important?
The 10–20 system defines electrode positions proportionally between four anatomical landmarks—nasion, inion, and the left and right pre-auricular points—so that a labeled channel like "Cz" refers to the same location in every lab. This standardization ensures datasets are directly comparable and allows accurate spatial analyses, such as bad-channel interpolation.
Why is it essential to document the online reference electrode used during an EEG recording?
The raw data file stores voltages relative to the online reference, so the choice of reference (e.g., Cz, linked earlobes, or average) permanently imprints the numbers, even if re-referencing later. Without documenting the original reference, a future analyst cannot understand the baseline subtracted or assess whether subsequent transforms distort genuine brain responses.
What role does sampling rate play in EEG recordings, and how does the Nyquist theorem apply?
The sampling rate determines the temporal resolution of the digitized signal, with the Nyquist theorem stating that the highest faithfully represented frequency is less than half the sampling rate. For example, a 500 Hz sampling rate can recover frequencies up to just under 250 Hz, and research-grade EEG typically operates between 250 and 1000 Hz. An accurate sampling rate is critical because it constrains all downstream timing-related analyses.
What are the two dominant open data formats for EEG, and what do they store?
The European Data Format (EDF) is a compact container that stores multiple channels with a header specifying sampling rate, channel labels, and physical dimensions. BrainVision spreads information across three linked files: a header (.vhdr), a marker file (.vmrk), and a binary data file (.eeg), all of which ensure unambiguous sharing and reproducibility.
Why is a complete channel map and spatial coordinates necessary for a raw EEG file?
A channel map with standard labels and 3D coordinates allows any spatial analysis, such as interpolating bad channels from neighbors or projecting signals to cortical source models. For example, artifact classifiers rely on spatial topographies, and interpolation requires knowing exact electrode locations; without this, such analyses fail.
What essential metadata must be recorded in an EEG file header, and why?
The header must include the precise sampling rate, recording date, channel labels with 3D coordinates, and unambiguous labels for auxiliary channels like EOG or EMG. This information is critical because an incorrect sampling rate can warp timing irreversibly, and a correct channel map is necessary for spatial interpolation and source modeling.
Why is EEG useful for research?
EEG offers very fine temporal information, making it useful for studying event-related responses, ongoing rhythms, sleep, attention, sensory processing, and other time-sensitive phenomena. Its interpretation remains dependent on experimental design and signal quality.
What are common EEG artifacts?
Common artifacts include eye blinks, eye movements, muscle activity, electrode movement, poor contact, cable motion, and electrical interference. They may affect one channel or many channels and can overlap with frequencies of scientific interest.
What is preprocessing in EEG analysis?
Preprocessing is the documented set of operations used to prepare recordings for analysis. It can include filtering, re-referencing, bad-channel handling, artifact identification, epoching, baseline correction, and quality control.
Emotiv is a neurotechnology leader helping advance neuroscience research through accessible EEG and brain data tools.
Medical Disclaimer: The information provided on this website is for educational and informational purposes only and is not intended as medical or health advice. This content may contain errors and should not be relied upon to make life-altering health, medical, or lifestyle choices. Always seek the advice of your physician or other qualified health provider with any questions you may have regarding a medical condition or treatment.
Christian Burgos