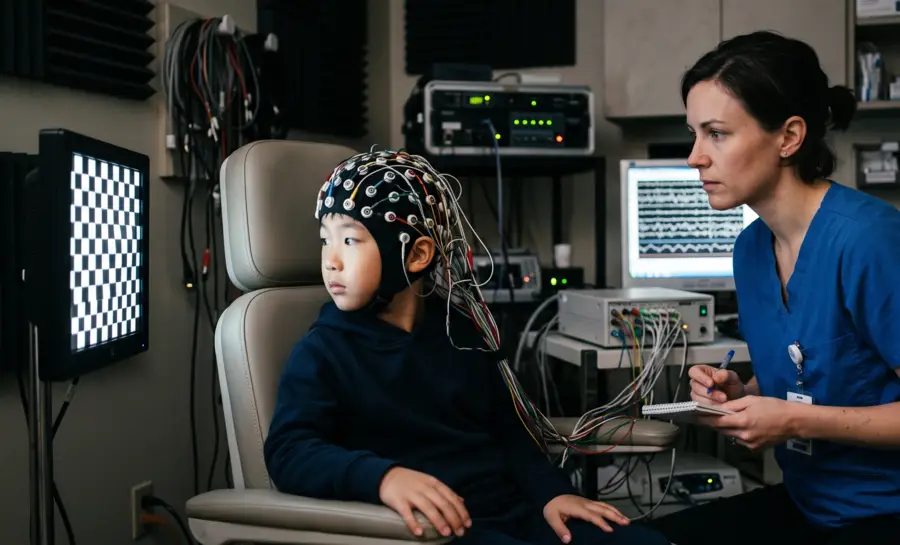
Visual evoked potentials, commonly abbreviated as VEPs, are electrical signals recorded from the scalp over the visual cortex in response to a visual stimulus. In contrast to structural imaging, which shows the physical shape of the brain, a VEP reflects how quickly and how strongly the visual pathway carries information from the retina to the primary visual cortex.
Because the measurement is noninvasive and relies only on electrodes placed on the skin, it has become a practical way to track conduction speed and cortical processing.
What is a Visual Evoked Potential (VEP)?
A visual evoked potential is an electrical response generated by the visual system after a person sees a defined stimulus. The response is recorded from electrodes placed on the scalp, usually over the occipital region near the visual cortex.
Unlike a standard measure of eyesight, the test evaluates how visual information travels through the pathway from the eye toward the brain. It is noninvasive and does not require an injection or an electrical stimulus to the eye.
How Does a VEP Test Work?
During testing, the person looks at a visual target while sensors detect small changes in electrical activity. A computer averages responses from repeated stimuli because each individual signal is very small and can be obscured by background brain activity. The resulting waveform is assessed for characteristics such as latency, or the time taken for the response to appear, and amplitude, which reflects the size of the recorded response.
The recording resembles an evoked response rather than a photograph of the brain. It provides functional information about the visual pathway, including areas that may be difficult to assess through direct examination. VEP recording is related to broader EEG methods because both use scalp electrodes to measure electrical activity, although the purpose and stimulus conditions differ.
Types of Visual Evoked Potential TestsTypes of VEP Tests
Different VEP protocols use different visual stimuli. The choice depends on the research question, the person’s ability to fixate on a target, and the quality of the visual input available during the examination.
Common approaches include pattern-based testing, in which a structured image changes on a screen, and flash testing, in which brief flashes of light stimulate the visual system.
VEP type | Typical stimulus | Potential use |
|---|---|---|
Pattern-reversal VEP | A checkerboard reverses its light and dark squares | Assessing responses when fixation and visual detail are reliable |
Pattern-onset or pattern-offset VEP | A pattern appears or disappears | Examining responses to changes in a structured visual field |
Flash VEP | Brief flashes of light | Testing when a person cannot reliably view or fixate on a patterned target |
These categories are not interchangeable in every setting. Pattern-based recordings can provide a more structured measure when visual acuity and attention permit, while flash testing may be useful when those conditions are limited. Therefore, the protocol and reference standards matter when a clinician compares one result with another.
EEG Recording Techniques for a Clean Signal
Electrode Placement and Innovative Hardware Setups
Capturing a VEP begins with electrode placement. Standard setups place a limited set of electrodes over posterior scalp regions, where the visual cortex signal is strongest. Many research applications, however, use high-density arrays to capture topographical detail across the entire head.
For example, a non-magnetic 64-channel EEG cap was designed, constructed, and tested specifically for recording VEPs inside a strong MRI magnetic field. Therein, the authors reported that the larger number of channels made it possible to map the response with enough spatial detail to separate genuine visual cortex activity from noise.
Flexible & Wearable EEG Configurations
Meanwhile, in some settings, even the recording site itself has become more flexible. A wearable method called ear-EEG places electrodes inside the ear canal rather than across the scalp. When researchers Kidmose et al. compared ear-EEG against conventional on-scalp EEG for both auditory and visual evoked responses, the ear-based visual recordings reached a signal-to-noise ratio on par with conventional EEG recorded from electrodes placed over the temporal region.
The ear-EEG comparison was performed across a population of subjects, not in a single individual, and it included both steady-state and transient visual approaches. Steady-state responses were evaluated in terms of signal-to-noise ratio and statistical significance, while transient responses were examined through averaged event-related potential waveforms.
Meeting conventional EEG quality near the temporal region is notable because the ear canal is physically distant from the occipital cortex, where visual responses are largest. The result suggests that ear-EEG can offer a practical, low-profile option for recording VEPs outside a traditional laboratory cap.
Managing Artifacts and Brain-State Sensitivity
Artifact removal handles external noise, but the brain's own background state also affects the VEP. In a conventional recording, visual stimuli are delivered continuously or at fixed intervals, regardless of what the brain is doing in the moments before each flash.
An averaging algorithm took a different approach and computed the root mean square values of theta and alpha band EEG activity at the vertex in the one-second window before each stimulus. These are slower rhythmic brain activity patterns visible in standard EEG frequency bands. When prestimulus activity was high, the stimulus was blocked; when it was low, the stimulus was delivered.
Twelve healthy volunteers participated in the study. Compared with conventional continuous stimulation, this state-dependent triggering increased the N1-P2 amplitude at the vertex by about 35 percent, or 25 to 30 percent after an inter-stimulus interval correction. In addition, frontal, temporal, and parietal recording sites showed similar increases.
The study also noted that the frequency content of the prestimulus EEG influenced the shape of the resulting VEP, meaning that not only the overall amount of background activity but also its dominant rhythmic pattern matters for the final waveform.
Transient vs. Steady-State VEP Recording Methods
The way a visual stimulus is presented also shapes the VEP. Two broad approaches dominate the field: transient and steady-state.
A transient approach delivers a brief, discrete stimulus and then allows the brain to return to rest before the next one appears. The aforementioned state-dependent study used light stimuli lasting one second each. These flashes are not presented as a continuous rhythm, and that separation between trials prevents one response from overlapping with the next.
After many trials are time-locked to the stimulus onset and averaged, a characteristic waveform emerges. That waveform contains recognizable peaks such as the N1 and P2 components. Transient VEPs are particularly useful when the goal is to measure the exact timing and shape of discrete cortical responses to a single visual event.
On the other hand, steady-state visual evoked potentials, or SSVEPs, use periodic stimulation instead of isolated flashes. A flickering or modulated pattern produces a continuous brain response that follows the stimulation rhythm.
A 2015 review of steady-state methods traces this approach from early single-channel recordings of responses to simple modulated light to today's sophisticated digital displays, complex visual stimuli, and high-density recording arrays. Because the response is continuous, steady-state recordings can be analyzed differently from transient waveforms. They have been applied in basic vision science to study sensation and perception, and they continue to inform applied settings where sustained visual processing over time is of interest.
The choice between transient and steady-state methods depends on whether a researcher wants to capture a single discrete brain event or a sustained rhythmic response.
Aspect | Transient VEP | Steady-State VEP |
|---|---|---|
Stimulus | Brief isolated flashes | Periodic flicker patterns |
Response | Discrete waveform peaks | Continual rhythmic response |
Best for | Single event timing | Sustained processing studies |
How to Interpret VEP Waveforms: Latency, Amplitude, and Spatial Maps
The standard transient VEP contains several named peaks:
The N1 is a negative-going deflection that appears around 100 milliseconds after a visual stimulus.
The P2 is a positive-going deflection that follows shortly after.
Together, the N1-P2 complex is measured from the midline over the vertex and has become a standard marker of cortical processing because its size responds to both stimulus conditions and the brain's internal state.
Moreover, two features of this waveform carry different kinds of clinical information:
Latency is the time from stimulus onset to a given peak. It reflects how quickly visual information travels from the retina through the optic nerve and visual pathway into the cortex.
Amplitude is the size or strength of the electrical response. It reflects how many neurons are firing together and how synchronized that firing is.
A dissociation between the two has the potential to be diagnostically meaningful. In a study of Baltic progressive myoclonus epilepsy, patients showed significantly delayed VEP latencies but normal amplitudes. The authors proposed that this pattern pointed to impaired synaptic transmission rather than a loss of neurons.
If neurons were missing or damaged, amplitude would be expected to fall as well. The preservation of normal amplitude while latency lengthens suggested that the neurons were present, but their chemical signaling across synapses was slowed.
The authors reported that this slowing may reflect dopaminergic dysfunction, but the core finding is that latency and amplitude can be separated as functional markers.
Lastly, where the response appears on the scalp adds a third layer of interpretation. Because the visual cortex lies toward the back of the brain, VEP peaks are largest over posterior electrodes.
High-density arrays make this spatial pattern much clearer. For instance, in the simultaneous EEG-fMRI study, researchers created isopotential plots at the moment of the VEP peak around 100 milliseconds. An isopotential plot is a topographic map that connects scalp points of equal electrical voltage, forming contour lines similar to a weather map.
Those voltage contour maps corresponded well with the brain areas that became active on fMRI in primary and secondary visual cortices. This correspondence indicates that the scalp-recorded VEP does not capture a generic brain response. It faithfully reflects the spatial pattern of activity in visual cortical areas.
The Future of Visual Evoked Potential Testing
Future development is likely to focus on improving standardization, signal quality, and the ability to test people with different visual and communication abilities. More consistent protocols and carefully constructed reference databases may make results easier to compare across centers. Advances in recording hardware could also support faster setup and more reliable measurements outside traditional laboratory environments.
Research may further examine how VEP measures relate to structural imaging, retinal assessments, and other forms of neuroscience. Combining complementary measurements could clarify whether a signal change reflects the eye, optic nerve, or a more posterior part of the visual pathway. Such integration may improve disease monitoring, although it will still require validation in well-designed clinical studies.
Computational analysis may assist with waveform detection, quality control, and longitudinal comparison. These tools should be treated as aids to interpretation rather than independent diagnostic authorities. The future value of VEP testing will depend not only on technical sensitivity, but also on transparent methods, clinically meaningful reference standards, and careful attention to the limits of the measurement.
Why Measuring the Visual Pathway Timing Matters for Brain Science
Visual evoked potentials offer a uniquely direct window into how quickly and strongly the brain translates light into perception. The research presented here shows that this single electrical measurement can reveal whether nerve insulation, chemical communication between neurons, or the timing of cortical processing has gone off track. Because the test is noninvasive and requires no radiation, it becomes a practical way to measure changes in the visual system over time.
The growing flexibility of recording setups, from high-density caps to ear-based electrodes, makes this assessment more accessible across different settings. What remains consistent is the fundamental value: a simple, safe test that captures the functional integrity of a core sensory pathway.
References
Bonmassar, G., Anami, K., Ives, J., & Belliveau, J. W. (1999). Visual evoked potential (VEP) measured by simultaneous 64-channel EEG and 3T fMRI. Neuroreport, 10(9), 1893-1897.
Kidmose, P., Looney, D., Ungstrup, M., Rank, M. L., & Mandic, D. P. (2013). A study of evoked potentials from ear-EEG. IEEE Transactions on Biomedical Engineering, 60(10), 2824-2830. https://doi.org/10.1109/TBME.2013.2264956
Rahn, E., & Basar, E. (1993). Enhancement of visual evoked potentials by stimulation during low prestimulus EEG stages. International Journal of Neuroscience, 72(1-2), 123-136. https://doi.org/10.3109/00207459308991629
Norcia, A. M., Appelbaum, L. G., Ales, J. M., Cottereau, B. R., & Rossion, B. (2015). The steady-state visual evoked potential in vision research: A review. Journal of vision, 15(6), 4-4. https://doi.org/10.1167/15.6.4
Mervaala, E., Keränen, T., Pääkkönen, A., Partanen, J. V., & Riekkinen, P. (1986). Visual evoked potentials, brainstem auditory evoked potentials, and quantitative EEG in Baltic progressive myoclonus epilepsy. Epilepsia, 27(5), 542-547. https://doi.org/10.1111/j.1528-1157.1986.tb03581.x
Frequently Asked Questions
What exactly are visual evoked potentials (VEPs) and what do they measure?
VEPs are electrical signals recorded from the scalp over the visual cortex in response to a visual stimulus. They measure how quickly and strongly the visual pathway carries information from the retina to the primary visual cortex, reflecting both conduction speed and cortical processing.
How are VEPs recorded, and what are the different electrode placement options?
VEPs are recorded using the same surface electrodes as an EEG, typically placed over posterior scalp regions where visual cortex signals are strongest. Recent advances include high-density arrays for detailed spatial mapping and wearable ear-EEG, which places electrodes inside the ear canal and can achieve signal quality comparable to conventional scalp recordings.
What is the difference between transient and steady-state VEP methods?
Transient VEPs use brief, discrete stimuli separated by rest periods, allowing the brain to return to baseline between trials, and are useful for measuring the exact timing and shape of individual cortical responses. Steady-state VEPs use continuous, flickering or modulated stimuli that produce a rhythmic brain response following the stimulation frequency, which is useful for studying sustained visual processing.
How are VEP waveforms interpreted in terms of latency, amplitude, and spatial distribution?
Latency is the time from stimulus onset to a peak and reflects how quickly visual information travels along the pathway, while amplitude reflects the number of neurons firing together and how synchronized that firing is. Spatial distribution adds a third layer, as VEP peaks are largest over posterior electrodes, and high-density arrays can create isopotential plots that map the scalp voltage pattern, which corresponds closely to active visual cortical areas on fMRI.
What is the N1-P2 complex and why is it important?
The N1-P2 complex consists of a negative-going deflection appearing around 100 milliseconds after a visual stimulus followed by a positive-going deflection, both measured over the midline at the vertex. This complex is a standard marker of cortical processing because its size is sensitive to both stimulus conditions and the brain's internal state, making it a practical outcome measure for testing whether a recording protocol has successfully isolated the visual response.
Why are VEPs considered a core tool for visual pathway assessment?
VEPs offer a direct, noninvasive view of how the retina, optic nerve, and visual cortex process a timed visual event with millisecond precision and no radiation exposure or injection. They are broadly sensitive to visual pathway dysfunction—from demyelinating diseases to synaptic transmission disorders—and provide a practical way to track functional integrity over time, especially in conditions like multiple sclerosis, optic neuritis, and progressive myoclonus epilepsy.
Emotiv is a neurotechnology leader helping advance neuroscience research through accessible EEG and brain data tools.
Medical Disclaimer: The information provided on this website is for educational and informational purposes only and is not intended as medical or health advice. This content may contain errors and should not be relied upon to make life-altering health, medical, or lifestyle choices. Always seek the advice of your physician or other qualified health provider with any questions you may have regarding a medical condition or treatment.
Christian Burgos