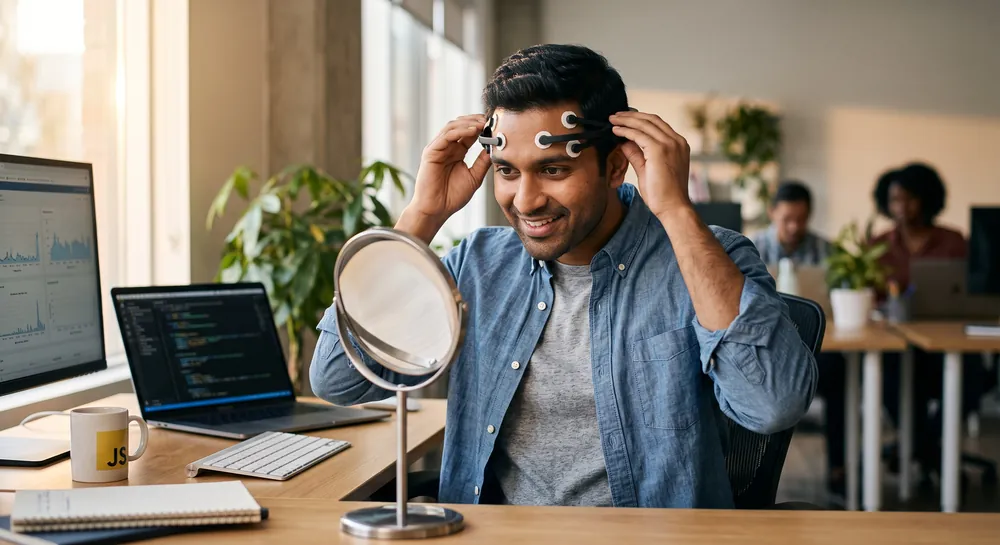
Frequency analysis serves as a cornerstone for interpreting neural data, enabling researchers to decompose complex waveforms into periodic components. By understanding these underlying rhythms, scientists can better characterize brain states and diagnostic findings.
What is Frequency Analysis?
Frequency analysis translates raw electrical oscillations into their constituent frequency components, revealing the rhythmic architecture of neural data.
When recording via EEG, the raw signal appears as a chaotic voltage fluctuation over time, making it difficult to discern subtle patterns. However, by utilizing mathematical transformations, researchers shift this view to a frequency spectrum where different brain waves become distinct, quantifiable peaks.
This shift is fundamental to modern neuroscience and quantitative diagnostics.
The Canonical Frequency Bands
EEG rhythms are grouped into a small number of named bands, each defined by how many cycles occur per second, or hertz (Hz).
Delta activity (4 Hz or slower) appears as slow, frequently high-amplitude waves. They are often entirely normal during deep sleep. Seeing prominent delta in an awake adult, however, can be a red flag typically associated with structural damage, metabolic disturbance, or diffuse brain dysfunction.
Theta activity (4 to 8 Hz) shows up often during drowsiness and has also been reported during meditative states. Diffuse theta can reflect a normal transitional state between wakefulness and sleep. When theta appears repeatedly in one localized region of the scalp rather than spread broadly, it raises suspicion for a focal structural lesion beneath that area.
Alpha activity (8 to 13 Hz) is the signature rhythm of relaxed wakefulness, most visible over the back of the head and known as the posterior dominant rhythm. Its defining visual feature is that it attenuates, or flattens out, the moment a person opens their eyes.
This is not just an incidental visual quirk. Research using transcranial alternating current stimulation, a technique that applies a weak oscillating electrical current to the scalp, found that stimulating the occipital cortex at a person's own individual alpha frequency measurably increased alpha power recorded on EEG, with effects that persisted after the stimulation ended.
That finding supports the idea that alpha is not an arbitrary visual pattern but a genuine, physiologically real oscillation that can be externally modulated, reinforcing why clinicians treat it as a reliable biomarker of normal cortical function.
Beta activity (13 to 30 Hz) is fast and low in amplitude. It commonly increases with alertness, anxiety, and certain sedative medications, particularly benzodiazepines and barbiturates, making it a rhythm clinicians often interpret alongside a patient's medication history.
Gamma activity (above 30 Hz) is rarely inspected during a routine visual read. Most standard EEG recordings apply filtering that removes or dampens this range specifically because it overlaps with muscle artifact and electrical noise, making it unreliable to interpret by eye at the bedside. Gamma has been linked to cortical processing in research settings, but it is not a tool used in standard visual diagnosis.
High-frequency oscillations, split into the ripple range (80 to 250 Hz) and the fast ripple range (250 to 1000 Hz), sit even further beyond what a routine scalp trace can visually resolve. Research done in Mayo Clinic using electrodes implanted directly in the temporal lobe found that ripples, concentrated at a mean of roughly 116 Hz, are increased in brain regions that generate seizures compared to control regions.
Fast ripples, however, were detected almost exclusively on ultra-fine microwire electrodes rather than the standard clinical macroelectrodes used in typical intracranial monitoring. This distinction means that high-frequency oscillations may carry real diagnostic value for localizing seizure-generating tissue, but that value currently depends on invasive recording equipment, not on what a neurologist can see on a standard scalp EEG.
Band | Frequency (Hz) | Key Visual Trait |
|---|---|---|
Delta | 4 Hz or slower | High-amplitude, abnormal in awake |
Theta | 4–8 Hz | Drowsiness, focal suggests lesion |
Alpha | 8–13 Hz | Posterior, blocks with eyes open |
Beta | 13–30 Hz | Fast, low amplitude, alert |
Gamma | Above 30 Hz | Filtered out, visually unreliable |
High-freq oscillations | 80–250, 250–1000 Hz | Invasive recording only |
How to Recognize Normal Rhythmic Patterns on EEG
A large part of visual EEG training involves learning what healthy brain activity looks like across different states of arousal, so abnormal patterns stand out by contrast.
During relaxed wakefulness, the posterior alpha rhythm dominates the back of the scalp and blocks, or attenuates, the instant the person opens their eyes and engages visual attention. This eye-opening response is one of the most reliable and visually obvious markers a neurologist checks for during a routine recording.
As a person drifts into drowsiness, the alpha rhythm fades and theta activity becomes more prominent. Distinct waveforms begin to appear, including vertex waves, sharp transient shapes seen near the top of the head.
As sleep deepens, sleep spindles emerge, brief bursts of rhythmic activity in the 12 to 14 Hz range, alongside K-complexes, large sharp waveforms that punctuate the trace. In the deepest stages of slow-wave sleep, high-amplitude delta activity becomes the dominant pattern, the same delta band that would be abnormal if seen during wakefulness.
One additional pattern worth recognizing is the mu rhythm, a central alpha-range oscillation recorded over the motor areas of the scalp. Unlike posterior alpha, mu desynchronizes, or flattens, when a person moves or even imagines moving. This is considered a normal variant and is a useful example of how the same frequency range can mean different things depending on where it appears and what makes it disappear.
Abnormal Rhythms and What They Reveal
Once a neurologist has a visual baseline for normal activity, deviations from that baseline become the diagnostic signal.
Slowing refers to the appearance of delta or theta activity where faster rhythms would normally be expected, either in a focal area or diffusely across the scalp. This pattern has clinical weight in the context of stroke.
Epileptiform patterns, including spikes, sharp waves, and spike-and-wave discharges, remain the visual gold standard for identifying seizure activity as it evolves on the trace.
Periodic patterns, such as lateralized or generalized periodic discharges, are recognized visually by their repeating, evenly spaced appearance. Their clinical meaning varies considerably, sometimes indicating seizure activity, sometimes reflecting metabolic encephalopathy, a brain dysfunction caused by disturbances in the body's chemistry.
The Hierarchy Behind Brainwave Frequencies
A separate line of research offers a conceptual explanation for why a single EEG trace so often shows several frequencies layered on top of each other rather than one clean rhythm.
Recordings from the auditory cortex of awake macaque monkeys revealed a structured relationship between frequency bands: the phase of the slower delta rhythm modulates the amplitude of theta activity, and the phase of theta in turn modulates the amplitude of gamma activity.
In plain terms, slower waves appear to set a rhythm that governs how strongly faster waves can express themselves, and this relationship shapes how responsive a group of neurons is to incoming stimulation at any given moment.
This is a genuinely useful framework for understanding EEG as a layered signal rather than a single wave. It helps explain why delta, theta, and gamma frequently coexist in the same recording rather than appearing in isolation.
Benefits and Limitations of Visual EEG Analysis
Visual frequency analysis is credited with several practical strengths:
Rapid bedside detection of seizures
Early warning signs of cerebral ischemia
Indicators of encephalopathy
Rough grading of coma severity
The limitations of the visual method itself are equally important to state plainly. Estimating frequency by eye is inherently subjective, and agreement between different readers examining the same trace is imperfect.
Subtle shifts in frequency, brief abnormal patterns, and anything occurring above the range typically preserved by standard filtering can be missed entirely.
Visual frequency analysis is best understood as a valuable clinical heuristic built on long-standing pattern recognition, not as a fully validated diagnostic instrument. Computational approaches to signal processing, including the cross-frequency coupling and high-frequency oscillation analyses are increasingly filling the gaps that visual inspection alone cannot reach.
Why Visual EEG Analysis Remains the Clinical Standard
Reading an EEG by eye means sorting a continuous voltage trace into recognizable frequency bands and comparing what is seen against a mental library of normal and abnormal patterns.
Alpha rhythm attenuating with eye opening, theta and spindles marking the descent into sleep, delta signaling either healthy deep sleep or a warning sign in an awake patient: these visual rules form the backbone of bedside EEG interpretation, and research confirms that at least one of them, alpha rhythmicity, reflects a genuine and externally modulatable cortical oscillation rather than a coincidental pattern.
Visual frequency analysis continues to serve as the starting point for clinical EEG interpretation because it is fast, requires no specialized equipment beyond the recording itself, and rests on genuine physiological rhythms. Its reach, however, has clear edges, and those edges are increasingly being mapped by the same computational methods it has long done without.
The Future of Frequency Analysis
Advancements in real-time processing capabilities will soon allow for instantaneous spectral monitoring, significantly reducing the gap between occurrence and analysis. This evolution will likely integrate machine learning algorithms to automatically identify characteristic frequency signatures, potentially flagging anomalies that human observers might overlook. Such developments promise to make real-time diagnostic interventions faster and more accurate.
Greater computational power will also enable the shift toward high-definition source localization, moving beyond scalp-level observations to visualize deep-brain rhythmic activity in three dimensions. As these methods mature, they will provide a more detailed understanding of brain connectivity, offering insights into the underlying mechanisms of complex neuropsychiatric conditions. This trajectory points toward a more granular approach to patient care.
Finally, the standardization of cross-platform analytical pipelines will become the norm, ensuring that findings can be reliably replicated across international research centers. By bridging the gap between hardware manufacturers and academic researchers, community-driven benchmarks will drive technical consistency in neurophysiological signal interpretation.
This collaborative environment will foster innovation in how we understand the complex interplay of brain rhythms.
What Brainwave Frequencies Reveal About Your Waking and Resting Mind
Counting wave cycles per second on an EEG trace gives a direct window into whether the brain is deeply asleep, calmly alert, or under strain. Patterns like the alpha rhythm fading when eyes open confirm that these rhythms are not abstract labels but real, functional oscillations tied to how we process the world. This visual approach, refined by decades of clinical observation, turns a wavy line into a practical readout of brain states that affect daily life.
The method has clear edges, though: it cannot spot the fast, high-frequency bursts that may pinpoint seizure sources or predict an approaching event, tasks that require computer analysis. Research also suggests that slower brainwaves coordinate faster ones, creating a layered signal that explains why a single trace looks so complex.
Recognizing this hierarchy shifts the EEG from a wavy line into a map of how different brainwave speeds interact, blending straightforward observation with depths that technology only now begins to explore.
References
Zaehle, T., Rach, S., & Herrmann, C. S. (2010). Transcranial alternating current stimulation enhances individual alpha activity in human EEG. PloS one, 5(11), e13766. https://doi.org/10.1371/journal.pone.0013766
Worrell, G. A., Gardner, A. B., Stead, S. M., Hu, S., Goerss, S., Cascino, G. J., Meyer, F. B., Marsh, R., & Litt, B. (2008). High-frequency oscillations in human temporal lobe: simultaneous microwire and clinical macroelectrode recordings. Brain : a journal of neurology, 131(Pt 4), 928–937. https://doi.org/10.1093/brain/awn006
Lakatos, P., Shah, A. S., Knuth, K. H., Ulbert, I., Karmos, G., & Schroeder, C. E. (2005). An oscillatory hierarchy controlling neuronal excitability and stimulus processing in the auditory cortex. Journal of neurophysiology, 94(3), 1904-1911. https://doi.org/10.1152/jn.00263.2005
Frequently Asked Questions
What does a neurologist actually see when they look at an EEG?
A neurologist sees a continuous line representing voltage changes over time and visually counts how many wave cycles repeat each second. They match this rhythm to known frequency bands, allowing them to interpret brain activity without the need for a computer to perform the mathematical breakdown.
Why is delta activity a concern in an awake adult?
Delta waves are slow, high-amplitude patterns that are perfectly normal during deep sleep. Seeing them in an awake adult is often considered a red flag because it typically suggests a problem like structural brain damage or a metabolic disturbance affecting brain function.
What is the alpha rhythm’s key visual feature?
The alpha rhythm is the brain's idling frequency during relaxed wakefulness, most visible at the back of the head, and its defining feature is that it disappears or flattens the moment a person opens their eyes. This reliable response to visual attention confirms that alpha is a genuine physiological oscillation, not just a random visual pattern.
How can the same frequency mean different things on an EEG?
The meaning of a rhythm changes based on where it appears on the scalp and what makes it disappear. For example, a rhythm in the alpha range over the back of the head that blocks with eye-opening is the normal posterior alpha, but the mu rhythm, an alpha-range oscillation over motor areas, flattens when a person moves or imagines moving.
What is “slowing” and why is it clinically significant?
Slowing refers to the appearance of slower delta or theta waves in areas where faster rhythms are expected, either across the whole brain or in one location. This pattern is clinically important because it can indicate reduced blood flow to brain tissue, making it a promising indicator in conditions like acute stroke.
What is a key structural limitation of visual EEG analysis?
A major limitation is that standard EEG recordings filter out fast activity above 30 Hz, meaning a neurologist simply cannot see high-frequency oscillations that may help localize seizure-generating tissue. Detecting these signals requires invasive recording equipment, creating a hard boundary for what the visual method can diagnose.
Why does visual analysis remain the standard method for reading an EEG?
It remains the clinical standard because it is a fast, practical method that requires no extra equipment beyond the EEG recording and is built on genuine physiological brain rhythms. It serves as the essential starting point for interpretation, even as its limits are defined by newer computational techniques it cannot replicate.
Emotiv is a neurotechnology leader helping advance neuroscience research through accessible EEG and brain data tools.
Medical Disclaimer: The information provided on this website is for educational and informational purposes only and is not intended as medical or health advice. This content may contain errors and should not be relied upon to make life-altering health, medical, or lifestyle choices. Always seek the advice of your physician or other qualified health provider with any questions you may have regarding a medical condition or treatment.
Christian Burgos