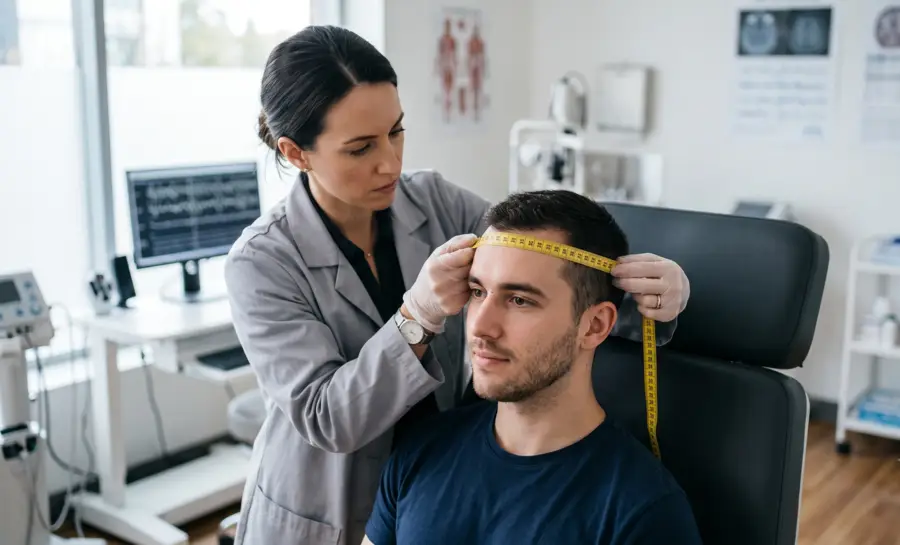
The 10-20 system is a measurement-based method that converts the unique proportions of an individual skull into a shared coordinate grid. Instead of guessing where the frontal lobe or the visual processing centers at the back of the brain might sit, technologists measure specific percentages of distance between fixed anatomical points on the head.
This produces electrode positions that correspond, in a general and repeatable way, to the cortical regions lying beneath the scalp. Because the method scales to head size rather than relying on fixed centimeter distances, it works consistently across adults, children, and even between individuals with notably different head shapes.
How EEG Technologists Measure the Scalp for Electrode Placement
Before any electrode touches the skin, four landmarks on the skull need to be located by hand. These are the nasion, the small indentation at the bridge of the nose where the forehead meets the nose; the inion, the bony bump felt at the base of the skull where it meets the neck; and two preauricular points, the small depressions found just in front of each ear canal, one on the left side and one on the right.
All four points are palpable, meaning they can be found by touch alone, which is why the system works reliably without any imaging equipment.
Once these landmarks are identified, the technologist measures the distance from the nasion to the inion using a flexible tape measure laid directly along the midline of the scalp, tracing the curve of the head from front to back. This single measurement becomes the reference distance for every front-to-back, or sagittal, electrode position.
Separately, the distance between the two preauricular points is measured as well, but this time the tape passes over the vertex, the highest point at the crown of the head, tracing a line from ear to ear. This second measurement defines the horizontal, or coronal, axis of the grid.
The Origins and Purpose of the 10-20 System
The name “10-20” refers to how the two reference distances get divided. Electrode rows are spaced at intervals equal to either 10% or 20% of the total measured distance.
Starting from the nasion along the midline, the first electrode mark sits at 10% of the nasion-to-inion distance, which locates a point called Fpz. From there, each subsequent mark is placed 20% further along the line, moving through positions labeled Fz, Cz, Pz, and finally arriving at Oz, which sits 10% above the inion.
Adding these up, 10% plus four steps of 20% plus a final 10% totals 100%, accounting for the entire nasion-to-inion distance. The same 10%-then-20%-intervals logic is applied to the transverse line running ear to ear, and then again around the full circumference of the head, building out a complete grid rather than just two crossing lines.
Understanding EEG 10-20 System Nomenclature
Every position on the 10-20 grid gets a name built from a letter and a number.
The letter identifies the general brain region sitting beneath that scalp location, while the number indicates how far to the left or right of the midline that electrode sits. Odd numbers always fall on the left side of the head, even numbers fall on the right, and the letter “z,” standing for zero, marks anything sitting directly on the midline.
The regional letters break down as follows:
Fp, for frontopolar, marking sites near the forehead and the front-most part of the prefrontal region.
F, for frontal, covering the broader frontal lobe area behind the forehead.
C, for central, sitting over the strip of cortex involved in movement and sensation.
P, for parietal, covering the upper-rear portion of the skull.
O, for occipital, at the very back of the head near the visual processing areas.
T, for temporal, over the sides of the head above the ears.
A, for auricular, referring to the earlobes themselves, which are frequently used as neutral reference points rather than active recording sites.
Applying this labeling scheme across the full measurement grid produces a standard array of 21 electrode sites, which is still the backbone of routine clinical EEG.
EEG Electrode Placement 10 20 System Overview
An effective EEG examination requires careful application of electrodes to ensure every region of the scalp is covered appropriately. Different regions of interest will often dictate which electrode subsets are prioritized during the session.
Understanding these specific groups helps in maintaining high signal quality throughout the recording period.
Frontal (F) Electrodes
Frontal electrodes are positioned over the forebrain, often playing a critical role in detecting activity related to higher cognitive functions and motor planning. By placing these sensors correctly, clinicians can monitor patterns associated with various states of consciousness and potential neurophysiological anomalies. These sites are essential for measuring frontal lobe function across many different diagnostic scenarios.
Temporal (T) Electrodes
Temporal sites are placed along the side of the head, covering regions critical for language processing, memory, and emotional regulation. Because these areas are situated near the skull base, proper placement is necessary to avoid muscle artifacts from the jaw or neck. This precise positioning is vital for examining temporal lobe electrical signatures.
Parietal (P) Electrodes
Parietal sensors are located on the top and sides of the scalp, posterior to the central sulcus, focusing on sensory integration and spatial awareness. These electrodes often interact with surrounding leads to provide a broader view of communication between different functional brain regions. Ensuring these are placed according to percentage-based intervals maintains spatial integrity relative to the frontal and occipital leads.
Occipital (O) Electrodes
Occipital leads consist of electrodes placed at the very back of the scalp over the visual processing centers. These nodes are highly sensitive to visual stimuli and the opening or closing of the eyes, which produces characteristic alpha rhythms. Proper measurement ensuring these are 10% above the inion is essential for accurate visual cortex activity assessment.
Why the 10-20 System Underlies Every EEG Montage and Advanced Mapping Method
Once the 21 standard sites are marked, clinical EEG technologists select subsets of them to build what is called a “montage,” which is simply an organized view of the electrical signals coming from a chosen group of electrodes.
Different EEG montages are chosen depending on what a clinician is trying to observe, but every one of them draws from the same underlying 10-20 grid. That shared foundation is what guarantees that a technologist in one hospital and a researcher in another country are sampling the same general anatomical zones, regardless of differences in head size or shape between their respective patients.
The 10-20 grid also functions as the base layer for far more detailed positioning systems used when higher spatial resolution is required, such as in research settings focused on pinpointing signal sources. The 10-10 system subdivides the original grid further to produce 81 electrode positions instead of 21, and the 10-5 system extends this subdivision even further, generating over 300 possible sites.
Despite the added density, both of these extended systems stay anchored to the same original percentage-based logic, which means a researcher today can still relate a 10-5 system electrode back to decades of clinical literature built entirely on the older, simpler 10-20 array.
This same coordinate framework has also become the default targeting method in non-invasive brain stimulation techniques, including transcranial magnetic stimulation (TMS) and transcranial direct current stimulation (tDCS). In these procedures, the 10-20 landmarks are used to decide where to physically place a stimulation coil or electrode pad on the outside of the head, aiming to influence activity in a specific region of cortex beneath that scalp location.
What the Evidence Says About the Limits of Scalp-Based Targeting
It is often assumed that the 10-20 system provides something close to a one-to-one correspondence between a marked scalp point and a specific fold of cortex underneath it, and that this precision is easy to achieve after brief training. The available research offers a more measured picture.
One 2019 study by Rick et al. examined how reliably novice raters could locate C3 and C4, the standard 10-20 sites used to approximate the primary motor cortex for tDCS. Two raters, each given two hours of instruction from a registered neurodiagnostic technician, measured these points on 25 adult participants.
The resulting inter-rater and intra-rater reliability, calculated using the intraclass coefficient, came out as only “low to fair.” The absolute distance between marked points, whether comparing two different raters or the same rater on two different days, stayed under 1.0 centimeter.
That may sound negligible, but the study's authors specifically caution that even a sub-centimeter discrepancy could carry clinical weight in populations whose brain structure has been altered by a lesion or by other anatomical changes. A margin of error that is harmless in a healthy volunteer is not automatically harmless in a stroke patient undergoing targeted stimulation therapy.
Moreover, a separate study by Kakisaka et al. raises a different kind of limitation. Researchers compared scalp EEG, recorded using the standard 10-20 placement with a few additional temporal electrodes, against magnetoencephalography (MEG) and against intracranial recordings taken directly from inside the brain, which served as the gold standard for detecting seizure activity.
In a patient with epilepsy originating from the lateral temporal cortex, scalp EEG detected zero percent of the spikes that the intracranial recording confirmed were present, while MEG detected 55%. The explanation traced back to the orientation of the electrical source itself: the spikes were generated by a source oriented nearly tangential, or sideways, to the scalp surface, a geometry that scalp electrodes are poorly suited to pick up.
In a second patient, whose epilepsy originated in the insula, a region tucked deeper within the brain, scalp EEG sensitivity reached 44% while MEG reached 83%. These numbers show that even a flawlessly applied 10-20 montage can still miss real electrical activity, not because of measurement error, but because of the physical direction that the signal happens to travel relative to the scalp.
Taken together, these findings point toward a consistent conclusion. The 10-20 system is an extremely useful shared language for electrophysiology, but it was never designed to guarantee millimeter-level cortical precision or uniform sensitivity to every possible signal source. Its strength lies in reproducibility and comparability across labs and studies, not in acting as a substitute for individualized brain imaging when that level of precision is actually required.
Why the 10-20 System EEG Matters in Clinical Practice
The 10-20 system serves as the universal language for neurologists and researchers globally. Because it relies on anatomical proportionality, clinicians can reliably repeat a study on the same patient weeks or months later to monitor changes. This temporal consistency is vital for tracking the progression of neurological conditions or evaluating the efficacy of long-term treatments without the interference of spatial discrepancies.
Beyond simple reproduction, this architecture allows for the application of advanced mathematical montages that rely on standardized electrode locations. When data is collected via this rigid system, analysts can transform the signal into different views, such as the Laplacian Montage EEG, to focus on local current density rather than global potential. This versatility allows a single standard recording to yield multiple insights depending on the specific research question or diagnostic goal.
Furthermore, the system facilitates the compilation of normative databases, which are essential for identifying abnormal electrical brain patterns. By comparing an individual study against a curated population standard, healthcare teams can distinguish primary neurological signatures from noise.
Conclusion
The 10-20 system remains an indispensable framework in the diagnostic landscape, providing the structure required for accurate and reproducible brain activity measurement in neuroscience. By adhering to these standardized intervals, practitioners ensure that data is comparable across sessions and individuals, bridging the gap between raw biological signatures and clear clinical insights.
References
Rich, T. L., & Gillick, B. T. (2019). Electrode placement in transcranial direct current stimulation—how reliable is the determination of C3/C4?. Brain sciences, 9(3), 69. https://doi.org/10.3390/brainsci9030069
Rusjan, P. M., Barr, M. S., Farzan, F., Arenovich, T., Maller, J. J., Fitzgerald, P. B., & Daskalakis, Z. J. (2010). Optimal transcranial magnetic stimulation coil placement for targeting the dorsolateral prefrontal cortex using novel magnetic resonance image‐guided neuronavigation (Vol. 31, No. 11, pp. 1643-1652). Hoboken: Wiley Subscription Services, Inc., A Wiley Company. https://doi.org/10.1002/hbm.20964
Kakisaka, Y., Alkawadri, R., Wang, Z. I., Enatsu, R., Mosher, J. C., Dubarry, A. S., ... & Burgess, R. C. (2013). Sensitivity of scalp 10‐20 EEG and magnetoencephalography. Epileptic disorders, 15(1), 27-31. https://doi.org/10.1684/epd.2013.0554
Frequently Asked Questions
What is the international 10-20 system?
The international 10-20 system is a standardized method for placing EEG electrodes on the scalp so that their positions are consistent across different people and recording sessions. It uses proportional measurements between fixed skull landmarks to create a scalable grid, ensuring that the same underlying brain regions are sampled regardless of head size or shape.
How are electrode positions determined with the 10-20 system?
A technologist first locates four palpable landmarks: the nasion, inion, and the two preauricular points. The distances between these landmarks along the midline and between the ears are measured with a flexible tape, and then electrode rows are marked at intervals of 10% or 20% of these total distances.
What do the letters and numbers in electrode labels mean?
The letter in a label indicates the broad brain region beneath that scalp location (for example, F for frontal, C for central, O for occipital). The number tells how far to the left or right of the midline the electrode sits, with odd numbers on the left, even numbers on the right, and 'z' (zero) marking the midline.
Why is the 10-20 system essential for EEG comparisons?
Because every lab follows identical measurement rules, recordings from different individuals or from the same person on different days sample the same general cortical areas. This reproducibility is what allows clinicians and researchers to compare findings reliably.
How does the 10-20 system support non-invasive brain stimulation?
Techniques like transcranial magnetic stimulation (TMS) and transcranial direct current stimulation (tDCS) use 10-20 landmarks to position coils or electrodes over approximate brain targets. For instance, sites C3 or C4 are conventionally used to stimulate the motor cortex, while F3 or F5 may target the dorsolateral prefrontal cortex.
What are some known limitations of the 10-20 system?
Measurement accuracy depends on the rater’s training, and even small placement errors can matter when brain anatomy is altered by injury or disease. Additionally, scalp electrodes may miss electrical signals that travel sideways or originate deep within the brain, simply because of the direction the signal propagates.
What are the 10-10 and 10-5 systems?
These are denser extensions of the original 10-20 grid for situations requiring higher spatial resolution. The 10-10 system subdivides the original sites to yield 81 electrode positions, while the 10-5 system further refines this to over 300 positions, both remaining grounded in the same percentage-based logic.
Is the 10-20 system precise enough for all brain-targeting needs?
The system ensures consistent inter-subject placement but does not provide millimeter-level correspondence to individual cortical folds. When exact targeting is critical, MRI-guided neuronavigation offers greater precision, though the 10-20 framework remains the standard when such tools are unavailable.
Emotiv is a neurotechnology leader helping advance neuroscience research through accessible EEG and brain data tools.
Medical Disclaimer: The information provided on this website is for educational and informational purposes only and is not intended as medical or health advice. This content may contain errors and should not be relied upon to make life-altering health, medical, or lifestyle choices. Always seek the advice of your physician or other qualified health provider with any questions you may have regarding a medical condition or treatment.
Christian Burgos