For decades, clinicians have relied on visual inspection of EEG traces to diagnose epilepsy or encephalopathy. Yet for a wide range of other neurological and psychiatric conditions, the human eye struggles to extract consistent, meaningful patterns.
Quantitative electroencephalography (qEEG) steps into this gap by applying signal processing algorithms that convert raw waveforms into a rich set of numerical features such as power in specific frequency bands, connectivity measures, and statistical comparisons against a normative database.
What Is qEEG?
qEEG, or quantitative electroencephalography, is a computerized analysis of data collected during an electroencephalogram. The term is sometimes used interchangeably with “brain mapping,” although the exact methods and reports vary between providers.
The recording is made through electrodes placed on the scalp. These sensors detect very small electrical signals, which are amplified, digitized, and processed into measures such as frequency, amplitude, distribution, and relationships between signals. qEEG therefore does not directly photograph brain tissue or measure blood flow; it describes features of electrical activity over time.
qEEG belongs to the broader field of neuroscience, where electrical signals are studied alongside behavior, physiology, and clinical history. Its value depends on how well the recording was obtained, how artifacts were handled, what reference data were used, and how the findings fit with other evidence. A report is often best understood as one component of an assessment rather than a stand-alone answer.
qEEG Brain Mapping Explained
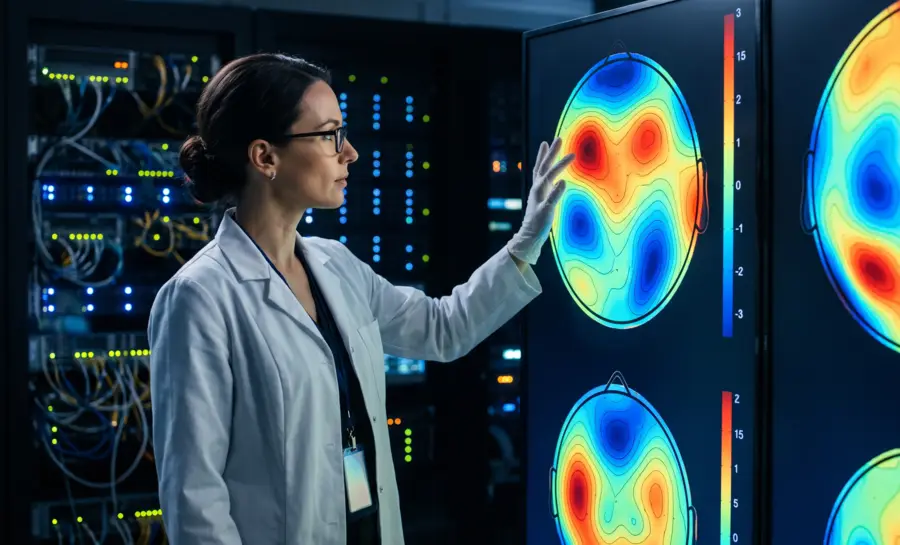
“Brain mapping” usually refers to presenting quantitative EEG findings in a visual format. A report may use scalp diagrams, graphs, tables, or color-coded maps to show how measured activity varies across locations and frequency bands. These displays can make complex numerical information easier to review, but a striking color pattern is not automatically evidence of disease.
Analysis may examine conventional frequency bands, including slower and faster rhythms, as well as measures of symmetry, connectivity, or coherence. The precise measures depend on the recording system and analytic protocol. Since electrical activity changes with age, alertness, medication, sleep, movement, and task demands, interpretation requires attention to the conditions under which the data were collected.
A useful map is therefore more than a picture. It is a structured summary of a signal that has been filtered, reviewed, and compared with an appropriate reference framework. Context shapes interpretation: the same statistical deviation can have different significance depending on symptoms, neurological examination, medical history, and the quality of the underlying recording.
How a qEEG Brain Scan Works
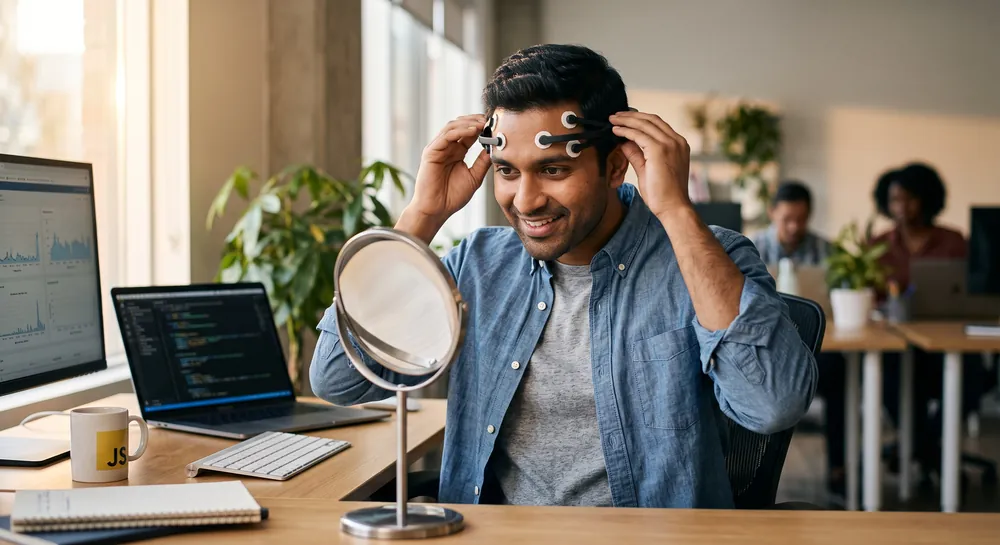
A qEEG brain scan begins with an EEG recording rather than an anatomical scan. The system captures electrical signals from multiple scalp locations while the person remains still and follows simple instructions, such as resting with the eyes open or closed. The resulting data are then inspected and analyzed using software.
The recording may be divided into short segments, or epochs, so that periods contaminated by artifacts such as movement, muscle tension, eye activity, or poor electrode contact, can be identified. Analysts may apply filters and other preprocessing steps before calculating quantitative measures.
During setup, a technologist measures or identifies scalp locations and attaches electrodes using a cap, paste, gel, or another approved arrangement. The electrode layout may follow a standardized placement system so that locations are reasonably consistent across recordings. Preparation can take longer than the recording itself, particularly when many channels are used.
The person usually sits or reclines in a quiet room. The technologist checks signal quality, explains when to open or close the eyes, and may ask for brief movements or other simple conditions depending on the protocol.
A typical session is painless, although the paste, cap, or need to remain still may feel inconvenient. Blinking, jaw clenching, talking, and head movement can produce artifacts. For that reason, a calm environment and clear instructions are part of the measurement process, not merely matters of comfort.
Raw EEG vs. qEEG
Traditional EEG interpretation for anything beyond seizure detection has a well‑documented reliability problem.
A comprehensive review found that when specialists visually inspected the same EEG traces for non‑epilepsy evaluations, their agreement scores were as low as 0.2–0.29 (on a scale where 1.0 is perfect). This means that two experts looking at the same recording often reached completely different conclusions, and the predictive validity of these readings hovered near zero.
Quantitative EEG sidesteps this subjectivity. The computer breaks the signal into short segments—even epochs as brief as 40 seconds—and computes spectral power, coherence, and other metrics.
Across multiple studies, this approach delivered split‑half and test–retest reliability figures above 0.9. Repeated recordings days or weeks apart produced highly stable results, a property essential for tracking a patient over time. By replacing an impressionistic glance with a measured, reproducible fingerprint, quantitative EEG gives clinicians a consistent baseline for measuring brain function.
Feature | Standard EEG | qEEG |
|---|---|---|
Primary output | Clinician-reviewed electrical recording | Quantitative measures and visual summaries |
Main emphasis | Time-based waveform patterns | Statistical and frequency-based features |
Typical interpretation | Clinical neurophysiology context | Clinical context plus computational comparison |
Common limitation | May be less suited to large numerical comparisons | Sensitive to protocol, artifacts, and reference data |
Why Normative Brains Should Be Age‑ and Sex‑Matched
Interpreting an individual’s qEEG demands a reference population. A deviation from the average is only meaningful if that average correctly accounts for normal biological variation.
One large normative database collected resting‑state EEG from 1,289 healthy participants aged 4.5 to 81 years. When the researchers built separate models for males and females and further divided groups by age, the accuracy of the resulting Z‑scores improved significantly. Without this stratification, the database would have mislabeled many healthy individuals as abnormal simply because their brain rhythms reflected a different age or sex.
The necessity of age‑matching becomes even clearer when considering what happens during healthy aging. A study using source localization to trace the origins of cortical rhythms found a linear decline in delta (2–4 Hz) power in the occipital region and a parallel reduction in alpha (8–13 Hz) power across parietal, occipital, temporal, and limbic areas as adults grew older.
If a 75‑year‑old’s qEEG were compared against norms derived from 25‑year‑olds, the naturally lower delta and alpha levels could be mistaken for pathological slowing. A Z‑score—the number of standard deviations an individual sits from the age‑ and sex‑matched mean—therefore becomes the only statistically defensible way to flag a genuine outlier.
Validity of qEEG Measures
Reliability is a prerequisite, but the numbers must also be valid since they must genuinely reflect neural function and predict clinical outcomes. The same review that established qEEG’s high reliability showed that its features possess strong content validity, grounded in decades of neurophysiology.
More persuasively, qEEG metrics consistently correlate with performance on neuropsychological tests and can predict outcomes such as treatment response. This predictive validity means that the colored brain maps and statistical scores are not abstract abstractions, and that they carry clinically relevant information.
For non‑epilepsy applications, qEEG’s predictive validity stands in stark opposition to the near‑zero validity of visual EEG reading. When combined with an appropriate normative framework, a qEEG profile offers a data‑driven complement to behavioral assessments, steering clinical decisions with objective, quantifiable feedback.
How qEEG Tracks Medication‑Induced Neurotoxicity
A concrete example of qEEG’s clinical value comes from a randomized, double‑blind study of two anti‑epileptic drugs. Twenty‑three healthy volunteers took either gabapentin (up to 3,600 mg/day) or carbamazepine (up to 1,200 mg/day) for 12 weeks. Before and after the medication period, researchers recorded a structured qEEG, administered cognitive tests, and collected subjective side‑effect ratings.
Both drugs caused a significant slowing of the posterior dominant alpha rhythm—the brain’s resting idling frequency. Carbamazepine had a more pronounced effect. Critically, 10 of the carbamazepine‑treated subjects and 6 of the gabapentin‑treated subjects fell outside the 95% confidence interval for an individual, meaning their alpha rhythm had slowed to a degree rarely seen in the unmedicated population.
While few participants substantially declined on objective cognitive tests, the magnitude of EEG slowing was linked to both greater subjective complaints of neurotoxicity and poorer overall cognitive performance on a summary score.
In this scenario, qEEG picked up a functional brain change that was more sensitive than standard pencil‑and‑paper tests. For a clinician adjusting medications, a shift in the alpha peak frequency beyond the individual’s normative range could serve as an early, objective indicator of cognitive side effects, prompting a dosage review before the patient’s daily life suffers.
From Normal Aging to Alzheimer’s Disease on the qEEG
The trajectory from healthy aging to dementia underscores how qEEG can map distinct disease signatures. Healthy aging, as described earlier, brings a gradual loss of delta and posterior alpha power.
Alzheimer’s disease (AD) disrupts this pattern in the opposite direction. When researchers compared resting‑state EEG from 26 AD patients, 53 individuals with mild cognitive impairment (MCI), and 246 healthy controls stratified by age, the AD group showed a significant increase in slow‑wave power (delta and theta) and a decrease in alpha power relative to age‑matched peers.
In essence, the Alzheimer’s brain paradoxically generates more slow activity while losing its faster, organized rhythms.
The theta‑to‑alpha ratio (TAR) captured this double hit as a single number and produced the largest, most significant group differences. To tease out the subtler alterations in MCI, the investigators developed a Power Distribution Distance Measure (PDDM) that examined the full shape of power probability distributions over time, rather than simply averaging across epochs. PDDM modestly enhanced the detection of MCI‑specific changes, revealing small but significant effects localized to temporal areas.
When these features were fed into machine‑learning classifiers, the model distinguished individual AD patients from controls with an area under the ROC curve (AUC) of 0.85—a strong effect that indicates, for example, a randomly chosen AD patient would be ranked higher than a randomly chosen control 85% of the time. For MCI, however, the AUC was a limited 0.6, translating to only modest accuracy.
Reassuringly, qEEG‑derived probabilities and ratio scores correlated with Mini‑Mental State Examination scores and other neuropsychological tests in the AD group, linking the electrical abnormalities to real‑world cognitive decline.
These findings highlight both promise and prudence. In established Alzheimer’s disease, qEEG carries a robust physiological signal. But as a stand‑alone screening tool for very early cognitive changes, its limited sensitivity for MCI means a normal reading cannot rule out incipient disease, and an abnormal one might be a false alarm. Used alongside clinical evaluation and other biomarkers, however, qEEG offers a non‑invasive, low‑cost window into neural dysfunction.
Common Pitfalls and Overclaimed Applications
Claims versus evidence. Many commercial platforms and popular articles present qEEG as a definitive diagnostic for several brain disorders. While research is ongoing, the current literature is cautious about supporting routine clinical use for these conditions.
Normative database quality matters. The entire interpretive framework collapses if the reference database is poorly constructed. Without rigorous age and sex stratification, normal variation can be relabeled as pathology. Any credible qEEG assessment must reference a scientifically vetted normative population.
Individual variability can obscure group effects. Even when a drug or disease produces a significant group‑level change, some individuals remain within normal limits. In the medication study, several participants did not exceed the 95% confidence interval for alpha slowing despite receiving a notable dose. A single qEEG value must therefore be interpreted in the context of the full clinical picture, not as an absolute litmus test.
Small effect sizes in early disease. The modest AUC of 0.6 for MCI means that qEEG alone cannot reliably identify the earliest stages of cognitive decline; false positives and false negatives are likely. Until effect sizes improve through more sophisticated analytics, qEEG serves best as an adjunct rather than a standalone screener.
How to Prepare for a qEEG Session
Preparation instructions vary according to the protocol and the purpose of the recording. The provider may give directions about hair products, caffeine, sleep, meals, and medications, because these factors can influence alertness or signal quality. Instructions should be understood as part of the test design rather than as universal rules for every qEEG appointment.
The recording environment is usually quiet, and the person may be asked to remain relaxed and minimize unnecessary movement. Hair and scalp cleanliness can make electrode contact easier, while fatigue or unusual sleep may alter the measured state. Any relevant factor that could affect the recording should be documented for the interpreting clinician.
Understanding Your qEEG Report
A qEEG report may include raw or processed waveforms, frequency spectra, topographic maps, statistical scores, and written interpretation. The format differs considerably between providers. Terms such as “elevated,” “reduced,” or “abnormal” describe a measurement relative to a chosen comparison and do not, by themselves, name a disease.
The report usually identifies the recording conditions, the quality-control process, and the reference framework when those details are clinically relevant. It should also separate observed data from interpretation. A useful explanation connects the findings to the referral question without implying more certainty than the evidence supports.
Questions about a report are best addressed through the qualified professional responsible for interpreting it. No single color, score, or ratio should be read in isolation. The report becomes more meaningful when considered with symptoms, history, examination, and other testing.
What Quantitative EEG Can and Cannot Tell Clinicians Today
Quantitative EEG transforms a century-old technology into an objective, reproducible tool by replacing subjective visual reading with stable numerical metrics. Its real-world value is already visible in concrete settings like detecting drug-induced cognitive slowing before standard tests notice it, and distinguishing Alzheimer's disease from healthy aging with strong accuracy.
Yet the same evidence that supports these applications also draws clear boundaries into its broader usage for other neurological disorders.
The reliability of every qEEG result hinges on the quality of the reference population it is compared against, since brain rhythms shift naturally with age and differ between sexes. When used as a complement to clinical evaluation rather than a standalone verdict, qEEG offers a low-cost, non-invasive window into brain function that can guide medication adjustments and flag cognitive decline.
Its future depends on growing normative datasets and sharper analytics, but its present role is already clear: a powerful objective aid, not a replacement for clinical judgment.
References
Thatcher, R. W. (2010). Validity and reliability of quantitative electroencephalography. Journal of neurotherapy, 14(2), 122-152. https://doi.org/10.1080/10874201003773500
Ko, J., Park, U., Kim, D., & Kang, S. W. (2021). Quantitative electroencephalogram standardization: a sex-and age-differentiated normative database. Frontiers in Neuroscience, 15, 766781. https://doi.org/10.3389/fnins.2021.766781
Babiloni, C., Binetti, G., Cassarino, A., Dal Forno, G., Del Percio, C., Ferreri, F., Ferri, R., Frisoni, G., Galderisi, S., Hirata, K., Lanuzza, B., Miniussi, C., Mucci, A., Nobili, F., Rodriguez, G., Luca Romani, G., & Rossini, P. M. (2006). Sources of cortical rhythms in adults during physiological aging: a multicentric EEG study. Human brain mapping, 27(2), 162–172. https://doi.org/10.1002/hbm.20175
Salinsky, M. C., Binder, L. M., Oken, B. S., Storzbach, D., Aron, C. R., & Dodrill, C. B. (2002). Effects of gabapentin and carbamazepine on the EEG and cognition in healthy volunteers. Epilepsia, 43(5), 482-490. https://doi.org/10.1046/j.1528-1157.2002.22501.x
Meghdadi, A. H., Stevanović Karić, M., McConnell, M., Rupp, G., Richard, C., Hamilton, J., ... & Berka, C. (2021). Resting state EEG biomarkers of cognitive decline associated with Alzheimer’s disease and mild cognitive impairment. PloS one, 16(2), e0244180. https://doi.org/10.1371/journal.pone.0244180
Frequently Asked Questions
What is the main difference between a traditional EEG and a quantitative EEG?
A traditional EEG relies on visual inspection of raw brainwave traces, which can be subjective and inconsistent between experts. A qEEG uses computer algorithms to convert those raw waveforms into numerical features like power in frequency bands, connectivity measures, and Z-scores, making the analysis reproducible and objective.
Why is it important for qEEG to be compared against age- and sex-matched norms?
Brain rhythms naturally change with age and differ between sexes, so an individual’s results are only meaningful when compared to a similar reference group. Without proper matching, a healthy older adult’s naturally slower brainwaves could be mistaken for a pathological abnormality.
How does qEEG improve reliability compared to visual EEG reading for non-epilepsy conditions?
Visual inspection of EEG for non-epilepsy evaluations has very low agreement between experts, sometimes near zero. qEEG, by using automated calculations on short brainwave segments, achieves high test-retest reliability, meaning repeated recordings produce stable results that can be trusted for tracking patients over time.
Why is the quality of the normative database crucial for qEEG interpretation?
The entire system of calculating Z-scores depends on having a well-constructed reference population that is properly stratified by age and sex. If the database is poorly built, normal biological variation can be falsely flagged as pathology, undermining the validity of the qEEG results.
What does qEEG stand for?
qEEG stands for quantitative electroencephalography. It refers to computerized numerical analysis of electrical activity recorded through EEG electrodes.
Is qEEG the same as a brain scan?
qEEG is sometimes called brain mapping, but it is not an anatomical imaging scan. It analyzes electrical signals recorded from the scalp rather than producing a direct picture of brain structure.
Is a qEEG session painful?
A qEEG session is generally noninvasive and does not involve electrical stimulation. Electrode paste, a cap, or the need to remain still may cause minor discomfort or inconvenience.
How long does qEEG take?
The total appointment length varies with preparation, recording conditions, the number of sensors, and whether additional tasks are included. Setup and data-quality checks can take substantial time.
What can affect qEEG results?
Sleep, alertness, medications, substances, stress, eye movements, muscle tension, movement, electrode contact, and technical interference can all affect a recording or its interpretation.
Who interprets a qEEG report?
Interpretation should be performed by a qualified professional with suitable training in EEG and the relevant clinical context. The report should be considered alongside other assessment information rather than in isolation.
Emotiv is a neurotechnology leader helping advance neuroscience research through accessible EEG and brain data tools.
Medical Disclaimer: The information provided on this website is for educational and informational purposes only and is not intended as medical or health advice. This content may contain errors and should not be relied upon to make life-altering health, medical, or lifestyle choices. Always seek the advice of your physician or other qualified health provider with any questions you may have regarding a medical condition or treatment.
Christian Burgos