EEG Time-Frequency Analysis: What It Is & Why It Matters
Emotiv
Updated on
Feb 12, 2026
EEG Time-Frequency Analysis: What It Is & Why It Matters
Emotiv
Updated on
Feb 12, 2026
EEG Time-Frequency Analysis: What It Is & Why It Matters
Emotiv
Updated on
Feb 12, 2026

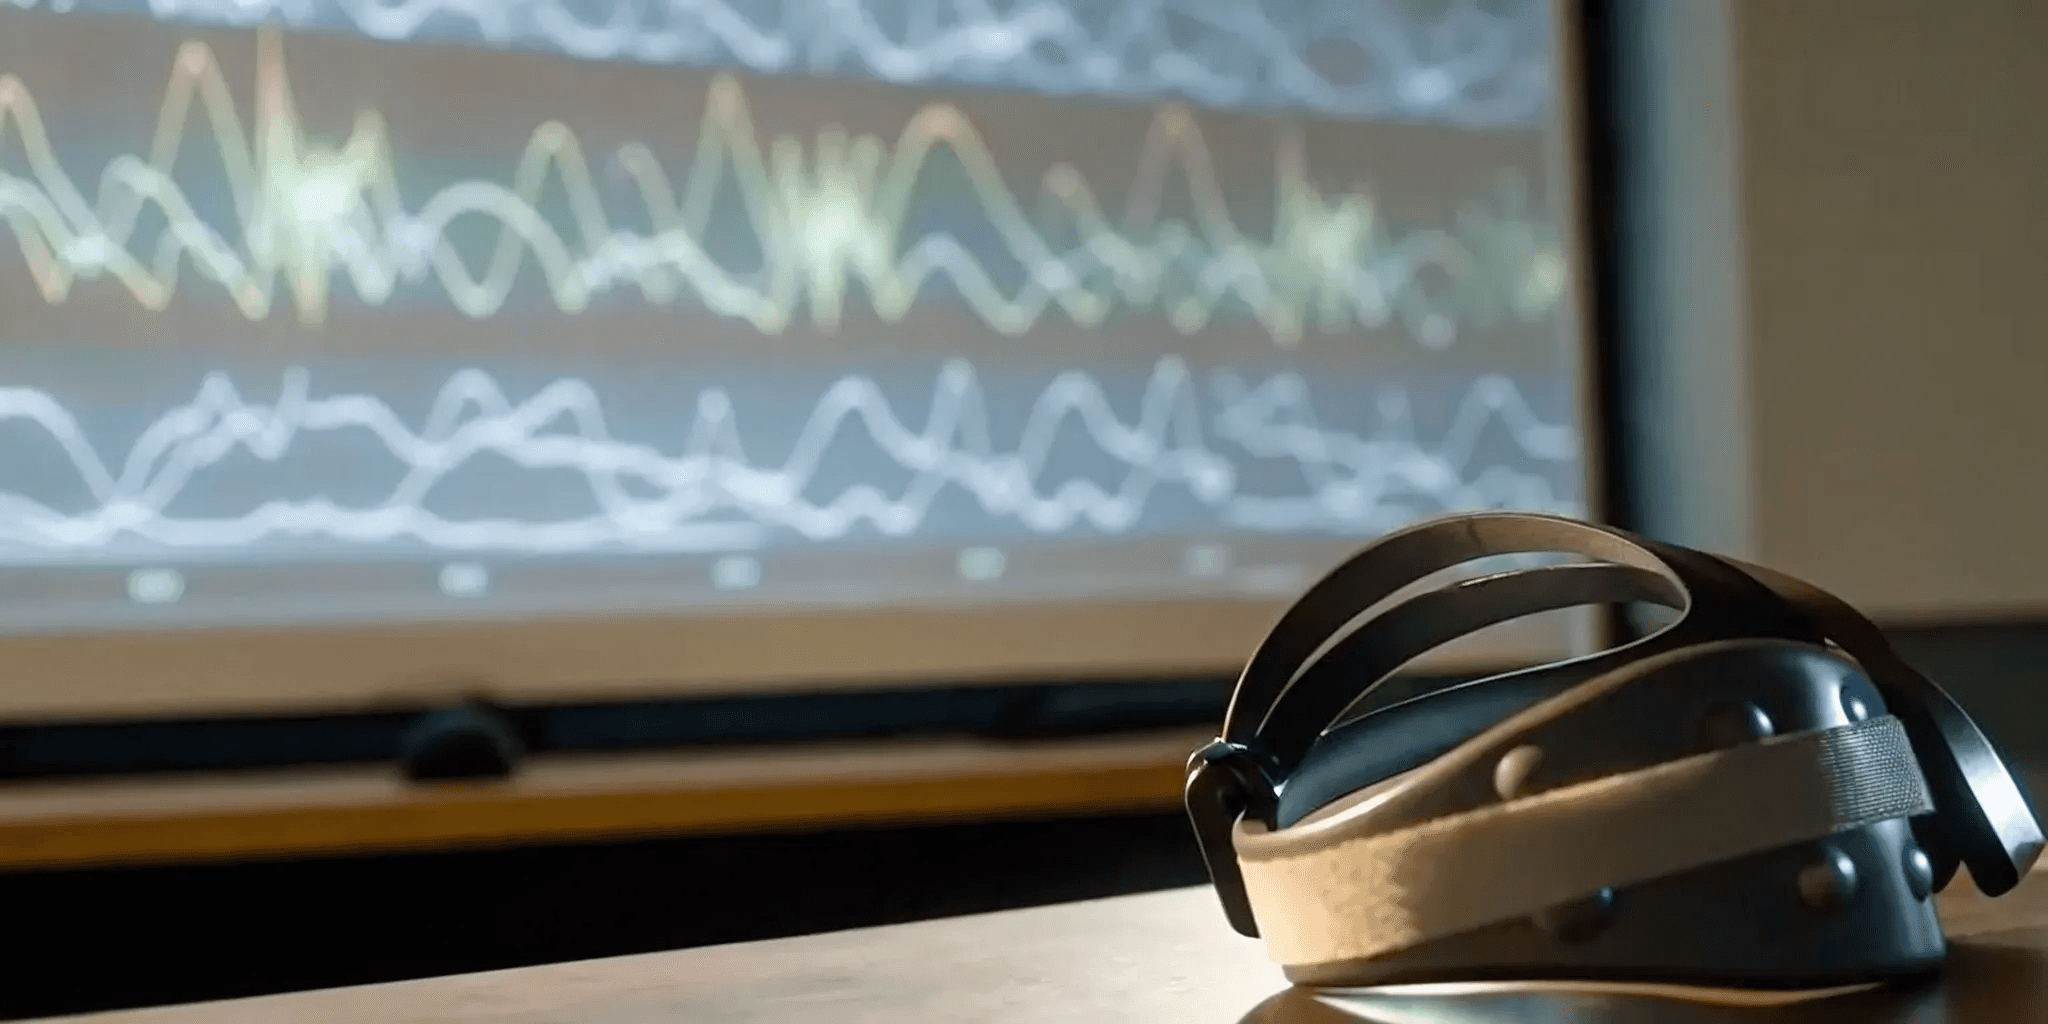
What if you could see the brain's activity unfold in high definition? For years, researchers have relied on methods that provide a blurry, long-exposure photograph of neural events, averaging out the fleeting bursts of activity that define cognition. This means critical details are often lost. EEG time-frequency analysis changes the game by offering a high-speed video instead. This approach allows you to pinpoint the brief, transient brain events tied to specific thoughts, feelings, or external stimuli. By capturing both the "what" (frequency) and the "when" (time) of brain activity, you can uncover a much deeper, more accurate narrative of what the brain is doing.
Key Takeaways
Go beyond static snapshots: Time-frequency analysis provides a dynamic view of brain activity, showing you not just what frequencies are present, but precisely when they occur over time.
Gain more precise insights: This approach is essential for capturing brief neural events that other methods miss, and it helps you more effectively identify and remove noise for cleaner, more reliable data.
Your setup determines your success: The quality of your analysis depends on choosing the right method for your research question and establishing a proper baseline for comparison, ensuring your interpretations are accurate.
What is EEG Time-Frequency Analysis?
Think of a raw EEG signal as a complex piece of music. A traditional analysis might tell you all the individual notes that were played, but it wouldn't tell you when they were played or how they formed a melody. Time-frequency analysis (TFA) acts like the full musical score. It shows you which frequencies (notes) are present in the brain's activity and precisely when they occur over time. Instead of a simple line graph, TFA creates a detailed 2D map that reveals how the brain's rhythmic patterns, or oscillations, change from one moment to the next.
This method is a powerful way to study the dynamic nature of the brain. It moves beyond static snapshots to provide a continuous view of neural activity, showing how different brain rhythms interact and shift in response to thoughts, feelings, or external stimuli. By looking at both time and frequency simultaneously, we can uncover patterns that would otherwise be hidden. For researchers and developers, this means gaining a much deeper understanding of the brain processes underlying cognition, emotion, and behavior. Tools like our EmotivPRO software are designed to perform this kind of sophisticated analysis, making it accessible for a wide range of applications, from academic studies to brain-computer interface development.
Why Traditional Frequency Analysis Falls Short
Older methods for analyzing EEG data, like Fourier-based power analysis or Event-Related Potentials (ERPs), have been useful, but they have significant limitations. Fourier analysis, for example, averages brain activity over a specific time window. It can tell you which frequencies were present on average during that period, but it loses all information about when exactly those frequencies appeared. It’s like knowing the ingredients in a recipe but not the steps. ERPs, on the other hand, are great for seeing the brain's direct response to a stimulus, but they miss all the background brain activity that isn't perfectly time-locked to that event.
How Time-Frequency Analysis Offers a Clearer Picture
Time-frequency analysis gives you the complete story. It overcomes the limitations of traditional methods by showing you both the "what" (frequency) and the "when" (time) of brain activity. This approach allows you to see how the power of different brainwave frequencies ebbs and flows from moment to moment. This is incredibly important because many cognitive processes, like paying attention or recalling a memory, involve rapid and dynamic changes in brain oscillations. TFA captures these fleeting events that other methods would average out or miss entirely, providing a much more accurate and detailed view of brain function as it unfolds.
Key Components of a Time-Frequency Map
The result of a time-frequency analysis is typically a 2D plot, often called a spectrogram or time-frequency map. It’s easy to read once you know what to look for. The horizontal axis represents time, and the vertical axis represents frequency. The color at any point on the map shows the power, or intensity, of a specific frequency at a specific moment in time. Think of it like a heat map for your brain's activity, where warmer colors (like red and yellow) indicate stronger power, and cooler colors (like blue) indicate weaker power. This visual representation makes it easy to spot patterns and identify key moments of neural activity.
How Does Time-Frequency Analysis Differ From Traditional Methods?
If you've worked with EEG data before, you might be familiar with traditional methods like the Fourier Transform. These techniques are great for identifying which frequencies are present in your data, but they have a major limitation: they treat the brain's activity as if it's static. They average the signal over a period, giving you a summary of the frequencies involved but losing the crucial detail of when those frequencies appeared. The brain, however, is anything but static—it's an incredibly dynamic system, constantly changing from one millisecond to the next. This is where time-frequency analysis comes in. Instead of giving you a single, flattened picture, it provides a rich, detailed map showing how different brainwave frequencies change over time.
Capturing Dynamic vs. Static Brain Activity
Think of traditional frequency analysis as taking a long-exposure photograph of a busy street. You’ll see the streaks of light from cars, but you won’t know which car was where at any specific moment. It gives you an overall picture of the activity, but the dynamic details are lost. Time-frequency analysis, on the other hand, is like shooting a high-speed video. It captures the brain's activity in real-time, allowing you to see how different neural oscillations rise and fall with precise timing. This approach separates the signal's power (its strength) from its phase (its consistency), revealing complex brain processes—like how different brain regions communicate—that static methods might miss entirely.
The Advantage of Higher Temporal Resolution
The biggest advantage of this dynamic approach is its high temporal resolution. Traditional methods tell you what frequencies are in your signal, but not when they occurred. For researchers trying to link brain activity to a specific event—like a person reacting to an image or making a decision—this timing information is everything. Because EEG signals are constantly changing, knowing the exact moment a certain frequency band becomes active is critical. Time-frequency analysis provides this context, revealing precisely when specific frequencies appear, strengthen, or fade away. This allows you to build a much more accurate timeline of cognitive events as they unfold in the brain.
Decomposing Signals with Greater Precision
Beyond just timing, time-frequency analysis allows you to decompose the EEG signal with much greater precision. It helps you see how the power of different frequencies changes over time, even when those changes aren't tied to a specific, obvious event. This detailed breakdown makes it easier to characterize the distinct oscillations within your data, from slow-wave delta activity during sleep to fast-paced gamma waves associated with focused attention. By isolating these components, you can better understand their function and significance. This level of detail is essential for anyone conducting academic research or developing sophisticated brain-computer interfaces.
What Are the Key Advantages of This Approach?
Switching to time-frequency analysis isn't just about creating more complex graphs; it's about gaining a fundamentally deeper and more accurate understanding of brain dynamics. This approach moves beyond the static, averaged-out view of traditional methods to reveal the intricate, moment-to-moment changes in neural activity. By looking at which frequencies are active and precisely when they occur, you can uncover patterns that are completely invisible with other techniques. This clarity is essential for anyone serious about interpreting EEG data. Whether you're exploring cognitive processes, developing a brain-computer interface, or conducting clinical research, this method provides a richer, more detailed narrative of what the brain is doing over time. Instead of seeing a blurry, long-exposure photograph of brain activity, you get a high-definition video. This allows you to connect specific mental states or external events to precise neural signatures, which is a game-changer for making meaningful discoveries. The advantages ripple through every stage of research, from cleaning your data more effectively to drawing more robust conclusions about brain function and connectivity. It’s the difference between knowing that something happened in the brain and knowing exactly when and how it happened.
Detect Brief Brain Events
The brain operates on a millisecond timescale, with thoughts and reactions causing fleeting bursts of neural activity. Traditional frequency analysis can miss these brief events by averaging the signal over time. Time-frequency analysis, however, acts like a high-speed camera for your data. It provides a detailed view of how brain oscillations change from one moment to the next, making it ideal for capturing transient neural activities. This allows you to pinpoint short-lived brain events tied to specific stimuli or cognitive functions, giving you a much more precise picture of the brain's real-time responses.
Understand Brain Oscillations and Connectivity
Understanding how different brain regions communicate is a central goal in neuroscience. Time-frequency analysis is a powerful tool for this because it helps you better characterize the oscillations contained in EEG data. By seeing when and where certain frequency bands become active, you can begin to understand the dynamics of brain connectivity. This approach helps reveal how networks of neurons synchronize and desynchronize to process information, support cognition, and execute tasks. It offers a more nuanced view of functional relationships between brain areas, which is critical for advanced academic research.
Identify Artifacts More Effectively
Clean data is the foundation of good research. Artifacts—electrical noise from things like eye blinks, muscle tension, or environmental interference—can easily contaminate an EEG signal and lead to incorrect conclusions. By separating the signal into its time and frequency components, you can identify and remove these artifacts with much greater precision. Many have a distinct signature in a time-frequency plot that makes them easy to spot. This leads to cleaner, more reliable data, ensuring that the patterns you're analyzing reflect genuine brain activity, not just noise.
Analyze Signals That Change Over Time
The brain is anything but static; it's a dynamic system that constantly adapts and responds. Time-frequency analysis is built for studying this dynamic nature. It provides a clear framework for analyzing signals that change over time, allowing you to examine how different frequency components evolve in response to specific stimuli or tasks. For example, you can see how alpha waves decrease or gamma waves spike at the exact moment a person engages in a memory task. Tools like our EmotivPRO software are designed to perform this analysis, giving you a direct window into the brain's evolving processes.
What Methods Are Used in Time-Frequency Analysis?
Once you’re ready to analyze your EEG data, you’ll find several established methods to choose from. There’s no single “best” technique; the right one depends entirely on your research question and the specific characteristics of the brain signals you’ve recorded. Each method offers a different way to look at the data, with unique strengths and trade-offs. Think of them as different lenses for your microscope—some are better for a wide view, while others excel at focusing on tiny, fleeting details.
The most common approaches you’ll encounter are Wavelet Transforms, Short-Time Fourier Transforms (STFT), the Hilbert-Huang Transform (HHT), and Multitaper Methods. Understanding the basics of each will help you make an informed decision for your project. For instance, if you’re looking for brief, high-frequency bursts of activity, one method might be more suitable than if you’re analyzing slow, steady brain rhythms. Our EmotivPRO software is designed to support these advanced analyses, giving you the flexibility to apply the right method for your data.
Wavelet Transforms
Wavelet transforms are a popular choice for EEG analysis, and for good reason. They are exceptionally good at analyzing signals that aren't stable, which is a perfect description of brain activity. Unlike some other methods, wavelets provide a great balance, offering solid time localization for high-frequency events and good frequency localization for low-frequency events. This adaptability makes them ideal for capturing transient neural events, like the brain's response to a sudden stimulus. The transform essentially breaks down the signal into a set of functions called wavelets, allowing you to see precisely when a specific frequency component occurred. This makes it a powerful tool for any academic research focused on dynamic brain processes.
Short-Time Fourier Transforms (STFT)
The Short-Time Fourier Transform, or STFT, is one of the foundational techniques for time-frequency analysis. The process is straightforward: it segments the continuous EEG signal into short, overlapping windows and then applies a standard Fourier Transform to each small segment. This gives you a series of frequency snapshots over time. The main challenge with STFT lies in the trade-off between time and frequency resolution. A short window gives you precise timing but a blurry view of the frequencies, while a long window gives you a clear view of frequencies but makes it hard to pinpoint when they happened. Despite this limitation, STFT is a reliable and computationally efficient method for many applications.
The Hilbert-Huang Transform
For signals that are particularly complex—meaning they are both non-linear and non-stationary—the Hilbert-Huang Transform (HHT) is an incredibly effective method. HHT works in two stages. First, it uses a process called empirical mode decomposition (EMD) to break the signal down into a small number of simpler components called intrinsic mode functions (IMFs). Then, it applies the Hilbert transform to each of these components to obtain instantaneous frequency data. This approach is data-adaptive, meaning it doesn't assume the signal behaves in a certain way. This makes it well-suited for exploring the intricate dynamics of EEG signals without the constraints imposed by predefined basis functions used in other transforms.
Multitaper Methods
When dealing with noisy data, which is common in EEG recordings, multitaper methods offer a robust solution. Instead of using a single window function to analyze a segment of data (like in STFT), this approach uses several different orthogonal window functions, known as tapers. It calculates a spectral estimate for each taper and then averages the results. This process significantly reduces the variance, or noise, of the spectral estimate, leading to a smoother and more reliable time-frequency representation. It’s an excellent way to improve the signal-to-noise ratio and gain a clearer picture of the underlying neural oscillations, especially when analyzing subtle brain activity.
How to Select the Right Method
Choosing the right analysis method comes down to your specific research goals and the nature of your EEG data. There is no one-size-fits-all answer. Start by considering your signal: is it stationary or non-stationary? Are you looking for brief, transient events or sustained oscillations? For non-stationary signals where brain activity changes rapidly, a wavelet transform is often preferred. If your signal is relatively stable, the computationally simpler STFT might be sufficient. Ultimately, the best approach is to understand the trade-offs of each method, particularly regarding time and frequency resolution, and align your choice with the questions you aim to answer.
What Challenges Should Researchers Expect?
Time-frequency analysis is an incredibly powerful tool, but like any advanced method, it comes with its own set of challenges. Being aware of these potential hurdles from the start can help you plan your research more effectively and produce more reliable results. From selecting the right parameters to managing heavy computational loads and interpreting the data correctly, here are a few key challenges to anticipate as you begin your work.
Handling Complex Parameter Selection
One of the first things you'll notice is that time-frequency analysis isn't a "plug-and-play" solution. Methods like STFT and wavelet transforms require you to make some important decisions upfront. You'll need to carefully select parameters like window length and overlap, which directly impact how the data is processed and visualized. The ideal settings aren't universal; they depend entirely on the specific brain signals you're analyzing and the questions you're trying to answer. This step requires a thoughtful approach to ensure your analysis accurately captures the neural dynamics you're interested in.
Managing Computational Demands
Be prepared for some heavy lifting from your computer. Time-frequency analysis, especially with large datasets from multi-channel EEG systems, can be computationally intensive. Decomposing every data point across both time and frequency requires significant processing power. Before you start, it’s a good idea to confirm you have adequate computational resources. For researchers using our hardware, analysis platforms like EmotivPRO are built to streamline these demanding tasks, but optimizing your own analysis scripts for efficiency is also a valuable skill to develop.
Addressing Common Misconceptions About EEG
When you share your research, you might encounter some common myths about what EEG can do. The most frequent one is that EEG can "read minds." It's important to clarify that while EEG is excellent at measuring the timing of electrical activity in the brain, it doesn't interpret the content of thoughts. Another misconception relates to the data itself, where people might confuse induced brain activity with evoked responses. Educating your audience on these points helps set realistic expectations and fosters a better understanding of EEG technology.
Interpreting Data and Choosing a Baseline
Your interpretation of the final time-frequency map is only as good as your baseline. A baseline is a period of "neutral" brain activity that you use as a point of comparison for activity related to a specific event or task. Choosing the right baseline is critical. If your baseline period is poorly selected—for example, if it accidentally includes part of the brain's response to a stimulus—it can skew your entire analysis and lead to misleading conclusions. Taking the time to carefully define and justify your baseline period is a fundamental step for ensuring the integrity of your findings.
Explore Applications in Neuroscience Research
Time-frequency analysis isn't just a theoretical concept; it’s a practical tool that has opened up new avenues across many fields of neuroscience. By revealing the dynamic, moment-to-moment changes in brain activity, this method allows researchers to ask more nuanced questions about cognition, behavior, and brain health. From developing assistive technologies to understanding the complexities of sleep, the applications are as diverse as the brain itself. This approach helps translate complex neural data into meaningful insights, pushing the boundaries of what we can learn about the brain. It’s one of the most effective ways to see not just what the brain is doing, but how its activity unfolds over time. This detailed perspective is invaluable for anyone working with EEG data, whether they're exploring the fundamentals of cognition or building innovative new technologies.
Cognitive Neuroscience and Brain Oscillations
In cognitive neuroscience, we’re interested in the brain activity behind mental processes like attention, memory, and decision-making. Different brain oscillations, or brainwaves, are linked to specific functions. Time-frequency analysis is perfect for this because it shows how these oscillations change as someone performs a task. For example, you can see how alpha waves decrease when a person focuses their attention or how theta waves might increase during a memory task. This gives researchers a detailed look into the brain’s real-time processing, helping to connect specific neural patterns with cognitive behaviors. This level of detail is essential for academic research and education in the cognitive sciences.
Brain-Computer Interface Development
Brain-computer interfaces (BCIs) translate brain signals into commands for external devices, offering new possibilities for communication and control. The effectiveness of a BCI depends on its ability to accurately interpret a user's intentions from their EEG data. Time-frequency analysis is critical here because it can better characterize the oscillations that serve as the control signals. By isolating specific frequency changes that occur when a user thinks about a particular action, developers can build more reliable and intuitive BCI systems. This detailed analysis is a key step in creating the next generation of brain-computer interface technology.
Clinical Research and Seizure Detection
In clinical research, time-frequency analysis provides a powerful lens for examining neurological conditions. For instance, in epilepsy research, this method is used to analyze EEG data for patterns that may indicate a seizure. Researchers can use time-frequency maps to classify EEG segments and identify the unique signatures of seizure activity, which are often too brief or subtle to be caught by other methods. This application demonstrates how detailed signal analysis can contribute to a deeper understanding of complex neurological events, providing valuable information for the research community.
Sleep Research and Connectivity Analysis
Sleep is a dynamic process with distinct stages, each characterized by unique patterns of brain activity. Time-frequency analysis is an excellent tool for studying these changes throughout the night. It allows researchers to explore how brainwave frequencies shift during different sleep stages and how connectivity between brain regions changes. This is particularly relevant in studies examining conditions like Alzheimer's Disease, where sleep disturbances are common. By analyzing EEG data, researchers can identify how brain activity patterns during sleep differ between groups, offering insights into the brain’s function and providing access to tools for cognitive wellness.
Find the Right Hardware and Software
Once you understand the principles of time-frequency analysis, the next step is putting them into practice. The quality of your insights depends directly on the quality of your data, which is why selecting the right tools is so important. Your setup is a combination of the physical EEG system that captures brain signals and the software that helps you process and interpret them. Getting this combination right from the start will save you a lot of headaches and ensure your results are reliable and meaningful. Let's walk through what to look for in both your hardware and software, along with some best practices to follow.
EEG System Specifications to Consider
The foundation of any good EEG setup is the hardware. The electrodes are what pick up the electrical signals from the scalp, so their quality and placement are critical. Most research-grade systems use reliable silver-silver chloride (Ag-AgCl) electrodes to capture clean signals. You’ll also see references to the International 10-20 System, which is the standardized map for placing these electrodes. Following this system is essential because it ensures your measurements are consistent and comparable to other research studies. Our multi-channel headsets like the Epoc X are designed with these standards in mind to support reproducible science.
Choose Your Software and Prepare Your Data
With your hardware selected, you need software that can perform the complex calculations for time-frequency analysis. The right platform can help you easily calculate time-frequency power, which shows how the strength of different brain frequencies changes over time. Our EmotivPRO software is designed to handle this kind of analysis, letting you visualize and export data for further study. When you’re preparing your data for analysis, here’s a pro tip: always record a slightly longer time interval than your actual period of interest. This simple step helps you avoid potential data corruption at the edges of your segment, leading to a more accurate analysis.
Best Practices for High-Quality Data
Collecting high-quality data is a non-negotiable part of EEG research. Two key practices will help you get the cleanest signal possible. First, focus on achieving low electrode impedance—ideally below 10 K Ohms. This measurement reflects how good the connection is between the electrode and the scalp, and a low impedance means less noise. Second, use a system with a high common-mode rejection ratio (CMRR). A high CMRR means your amplifier is very effective at filtering out environmental electrical noise that could otherwise contaminate your brain signal data. Following these practices is fundamental for anyone doing serious academic research.
Get Started with Time-Frequency Analysis
Jumping into time-frequency analysis might seem complex, but it's really about following a clear process. With the right tools and a few best practices, you can move from collecting raw brain data to uncovering meaningful insights. The key is to start with a solid foundation: high-quality hardware, flexible software, and a reliable method for preparing your data. Let's walk through the essential steps to get you started on the right foot.
Choose the Right EEG Hardware for Your Research
The quality of your analysis depends entirely on the quality of your data, and that starts with your hardware. The electrodes on an EEG headset are what capture the brain's electrical signals. A typical setup includes active electrodes to measure activity, reference electrodes for comparison, and ground electrodes to reduce unwanted noise. Many researchers prefer headsets using silver-silver chloride (Ag-AgCl) electrodes because they provide stable and reliable signals. Your choice of headset should align with your research goals. For instance, our Epoc X offers 14 channels for robust research applications, while our high-density Flex headset provides 32 channels for more detailed brain mapping.
Find Essential Software Tools and Platforms
Once you've collected your EEG data, you'll need the right software to analyze it. Our EmotivPRO software is designed for detailed analysis and allows you to view raw EEG data in real-time, perform frequency analysis, and see performance metrics. For deeper time-frequency analysis, you can easily export the data for use in other programs. Many researchers use open-source toolboxes like FieldTrip, which offers a powerful suite of functions for advanced methods like Fourier analysis and Morlet wavelets. This flexibility allows you to integrate Emotiv hardware seamlessly into your existing research workflow, giving you control over your analytical approach.
Apply Best Practices for Reliable Results
To ensure your findings are accurate, it’s important to follow a few data preparation guidelines. First, when you segment your data around an event, it’s a good practice to select a slightly longer time interval than your period of interest. This simple step helps you avoid potential distortions or "edge artifacts" that can occur at the beginning and end of a data segment. Second, always compare the brain activity during your event to a baseline period, which is usually the quiet interval just before the stimulus occurred. This comparison makes it much easier to see significant changes in brain activity and interpret your results with confidence.
Related Articles
Frequently Asked Questions
What's the main takeaway? Why is time-frequency analysis better than just looking at brainwaves? The most important difference is that time-frequency analysis tells you when things happen in the brain. Traditional methods can give you a good summary of which brainwave frequencies were active over a period, but they average everything together. This approach shows you the precise moments that specific frequencies powered up or down, which is essential for linking brain activity to a specific thought, feeling, or action. It gives you the complete story, not just the summary.
I'm new to this. Which analysis method is best for beginners? There isn't a single "best" method, as the right choice really depends on your specific research question. However, many people find the Short-Time Fourier Transform (STFT) to be a good starting point because its approach is quite direct. It breaks the signal into small chunks and analyzes them one by one. For signals that change very quickly, a Wavelet Transform is often a more powerful choice. My advice is to start by understanding the goals of your project and then select the tool that best helps you answer your questions.
What's the most important thing to get right when collecting data for this type of analysis? Without a doubt, it's the quality of your initial signal. Time-frequency analysis is designed to find subtle patterns, and those patterns can easily be buried by noise. Focus on getting a clean recording from the very beginning by ensuring your electrodes have a solid, low-impedance connection to the scalp. A clean signal is the foundation of reliable results and will save you a massive amount of time and effort during the analysis stage.
What is a 'baseline' and why is it so critical for my results? A baseline is a short recording of neutral brain activity, typically taken right before your main event or stimulus begins. Think of it as your control measurement. It's what you compare your event-related brain activity against to see what actually changed. Without a clean and properly chosen baseline, you have no reference point, making it impossible to know if the patterns you're seeing are meaningful or just random noise.
Can I perform time-frequency analysis directly within Emotiv's software? Our EmotivPRO software is built to help you visualize and work with your data, offering real-time frequency analysis and performance metrics. For creating the detailed time-frequency maps discussed in this post, you can easily export the high-quality, raw data from EmotivPRO. This data is formatted to be used directly in popular academic toolboxes like FieldTrip or with custom scripts in platforms like MATLAB or Python, giving you full control over your analysis.
