Volume conduction means that a strong voltage recorded at one electrode does not necessarily mean the underlying brain activity originated directly beneath that electrode. It might have come from a source several centimeters away, its signal simply spreading wide enough to register at multiple sensors at once.
This creates a genuine problem for anyone trying to answer two very different scientific questions: where on the scalp is a particular pattern of activity concentrated, and what rhythm or frequency is the brain producing at that moment? These two questions require two different tools. One, the surface Laplacian, works on sharpening spatial detail. The other, the Fourier transform, works on decoding time.
Understanding what each tool actually does, and why neither one can substitute for the other, clarifies a lot of confusion for anyone reading EEG methods sections for the first time.
Laplace vs Fourier: An Overview
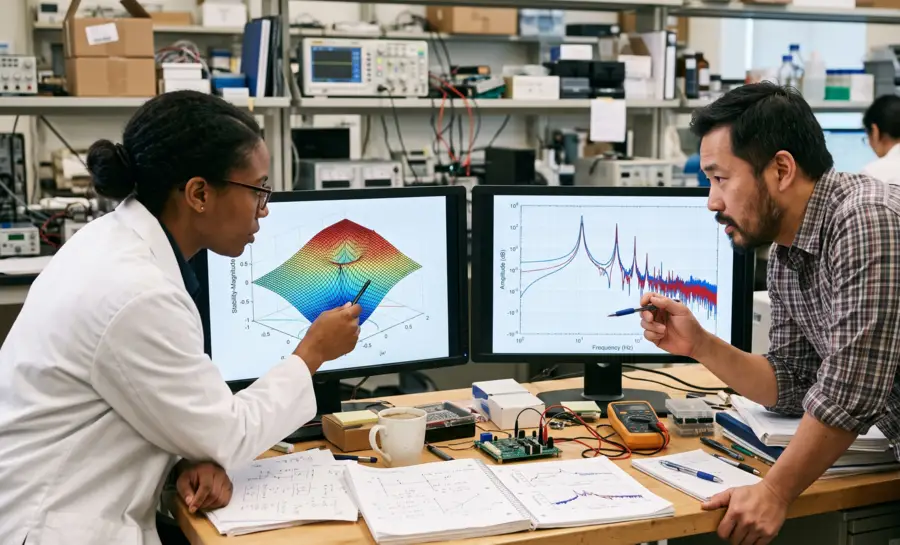
Engineers and scientists frequently choose between Laplace and Fourier transforms when designing systems or analyzing experimental data. While both mathematical tools serve to move signals from the time domain to a domain where frequency behavior is visible, they differ fundamentally in their scope, definitions, and underlying properties. Selecting the correct approach often changes the clarity of the result, especially when dealing with complex, real-world data streams that contain both steady oscillations and unpredictable transitions.
The Fourier transform is widely recognized for its ability to isolate frequency components in periodic or stationary signals. It relies on a purely imaginary frequency parameter, making it a subset of the more general Laplace transform.
Because it captures the spectral density of a signal without accounting for initial conditions or growth factors, it serves as the cornerstone of classical frequency analysis. In contrast, the Laplace transform uses a complex frequency parameter, which allows it to encapsulate both decaying and growing exponential behavior within the system response.
Choosing between these techniques involves evaluating the stability and initial state of the system in question. When a researcher focuses on the steady-state harmonic content, the Fourier approach remains the standard. Conversely, if one needs to evaluate the stability of a feedback system or account for transient periods, the Laplace transform provides significantly broader mathematical coverage. By balancing these requirements, analysts can choose the method that directly yields the information needed to interpret their specific data set effectively.
What the Surface Laplacian Reveals About Focal Brain Activity
The surface Laplacian is a spatial filter. It does not touch the timing of a signal at all.
Instead, it operates across the map of electrodes on the scalp, comparing the voltage at each individual sensor to the voltages recorded at its immediate neighbors. If an electrode's reading is meaningfully higher or lower than the average of the electrodes surrounding it, the Laplacian flags that spot as a likely local source. If the electrode's reading closely matches its neighbors, the Laplacian treats that as broad, diffuse activity rather than something sharply localized, and suppresses it in the output.
The practical result of this filtering is a topographic map with far less blur. Instead of large, smeared patches of activity that could plausibly have come from almost anywhere underneath a wide swath of scalp, the Laplacian-transformed map tends to produce tighter, more compact regions of activity. This conceptually connects to current source density, a related approach that also aims to estimate where current is actually flowing into or out of the scalp surface, rather than simply where voltage happens to be highest.
What the Fourier Transform Reveals About Brain Rhythms
Once the spatial question is set aside, an entirely different question comes into focus. A raw EEG time series, the jagged, constantly shifting voltage trace recorded from a single electrode over time, looks chaotic to the naked eye. Buried inside that apparent chaos, however, are recurring oscillations happening at different speeds simultaneously. The Fourier transform is the mathematical tool that separates a signal into these overlapping component rhythms.
Rather than looking across electrodes at a single moment in time, as the Laplacian does, the Fourier transform looks across time within a single electrode's signal. It takes that messy waveform and reorganizes it into a spectrum, essentially a list of how much of the signal's total energy belongs to each frequency band.
In EEG research, these bands are commonly labeled delta, theta, alpha, beta, and gamma, each associated with different ranges of oscillation speed, measured in cycles per second. A signal dominated by slow, large waves will show a spectrum weighted toward the lower end. A signal full of fast, small fluctuations will show more energy concentrated in the higher-frequency bands.
Crucially, the Fourier transform discards spatial information entirely. It does not care whether the electrode was placed near the front or back of the head, and it makes no attempt to determine whether the recorded activity was focal or spread across a wide area. Its entire purpose is temporal: given a single channel's activity over time, at what rhythm is the brain oscillating.
Tool | Analyzes | Answers | Output |
|---|---|---|---|
Surface Laplacian | Spatial electrode map | Where activity is focal | Sharpened spatial map |
Fourier Transform | Single electrode over time | What rhythms are present | Frequency spectrum |
Combining the Laplacian and Fourier Transform for Cleaner Spectra
Because these two tools solve separate problems, a widely taught approach in EEG analysis is to apply them sequentially rather than choosing one over the other.
The typical workflow involves running the surface Laplacian transform across the electrode array first, producing a new set of spatially filtered waveforms, and then applying the Fourier transform to those already-filtered signals rather than to the original raw recordings.
Volume conduction mixes signals from multiple sources into the raw recording at any single electrode. That means a raw time series is not really the story of one underlying neural rhythm. It is more like an overlapping recording of several rhythms from several nearby and distant sources, all blended together at that one point on the scalp.
When the Fourier transform is applied directly to this blended signal, the resulting frequency spectrum reflects that mixture. Genuine focal rhythms may end up diluted by broader, less specific activity picked up from other regions.
Applying the surface Laplacian first is meant to reduce that contamination before the frequency analysis even begins. By suppressing the broad, diffuse components and emphasizing the sharply local ones, the Laplacian step is intended to leave behind a waveform that is a closer approximation of the activity generated directly under that electrode. Running the Fourier transform on this filtered waveform should, in principle, produce a spectrum that better reflects the rhythmic activity of that specific patch of cortex rather than a blend of distant sources.
This combined approach is popularly described as producing “cleaner” or more spatially localized spectral estimates, and the underlying reasoning is logically consistent with what each individual tool does.
Holding Onto the Right Lens for the Question Asked
Every EEG recording in neuroscience carries a hidden tangle of overlapping information, and the choice of tool dictates what becomes visible.
The Laplacian sharpens the map of where activity peaks, while the Fourier transforms tunes into the hidden metronomes of brain speed, and mistaking their roles leads to sense-making built on false clarity. Applying the spatial filter before the temporal one follows a sound logic of cleaning distance-based contamination before asking about rhythm, though the step’s real benefit still depends on the specific data at hand.
What stays constant is the basic trade-off: methods that pinpoint location discard timing, and methods that reveal frequency ignore space. Carrying this conceptual split into any EEG method section prevents the common mistake of treating these distinct calculations as answering the same fundamental question.
References
Pascual-Marqui, R. D., Gonzalez-Andino, S. L., & Valdes-Sosa, P. A. (1988). Current source density estimation and interpolation based on the spherical harmonic Fourier expansion. International journal of neuroscience, 43(3-4), 237-249. https://doi.org/10.3109/00207458808986175
Frequently Asked Questions
What is the main problem that the surface Laplacian solves?
The surface Laplacian solves the problem of volume conduction, which is the smearing and blurring of brain signals as they travel through tissue and skull to an electrode. It acts as a spatial filter to provide a sharper estimate of where on the scalp activity is genuinely concentrated or focal.
What question does the Fourier transform answer in EEG analysis?
The Fourier transform answers the question of "what rhythm" by separating a single electrode's messy time series into its overlapping component frequencies. It reveals how much energy is in different oscillation bands like delta, theta, or alpha, focusing purely on temporal patterns.
Can the surface Laplacian be used to find brain rhythms, or vice versa?
No, these two tools are not interchangeable because they answer fundamentally different questions. The Laplacian sharpens spatial location ("where"), while the Fourier transform decodes rhythmic timing ("at what rhythm"), meaning one cannot substitute for the other.
Why would a researcher apply the surface Laplacian before using the Fourier transform?
Applying the Laplacian first spatially cleans the signal by reducing diffuse, distant activity mixed into the recording from volume conduction. The subsequent Fourier transform then produces a frequency spectrum that better reflects the rhythms of the specific patch of cortex directly under the electrode.
What is the spherical harmonic Fourier expansion (SHE) used for?
SHE is a computational method for estimating the surface Laplacian by modeling the scalp's electrical field across the entire head. Simulation research suggests this method gives better Laplacian estimates and outperforms simpler neighbor-comparison techniques for interpolating values.
How does the surface Laplacian identify a likely local source of brain activity?
The Laplacian compares the voltage at one electrode to the average voltage of its immediate neighbors. If the reading is meaningfully different, it is flagged as a local source, but if it closely matches the neighbors, it is suppressed as broad, diffuse activity.
What happens to an EEG signal after a surface Laplacian is applied?
The transformed output produces a topographic map with far less blur, showing tighter and more compact regions of activity. The timing of the signal is not altered; only its spatial representation across the scalp is sharpened to better indicate current flow.
Does combining the Laplacian and Fourier transform guarantee a better analysis?
The combined use is a sound heuristic based on the logic of reducing spatial contamination before frequency analysis, but it is not a guaranteed, universally quantified effect. A researcher still needs to verify that this sequential processing improves the results for their specific dataset.
Emotiv is a neurotechnology leader helping advance neuroscience research through accessible EEG and brain data tools.
Christian Burgos