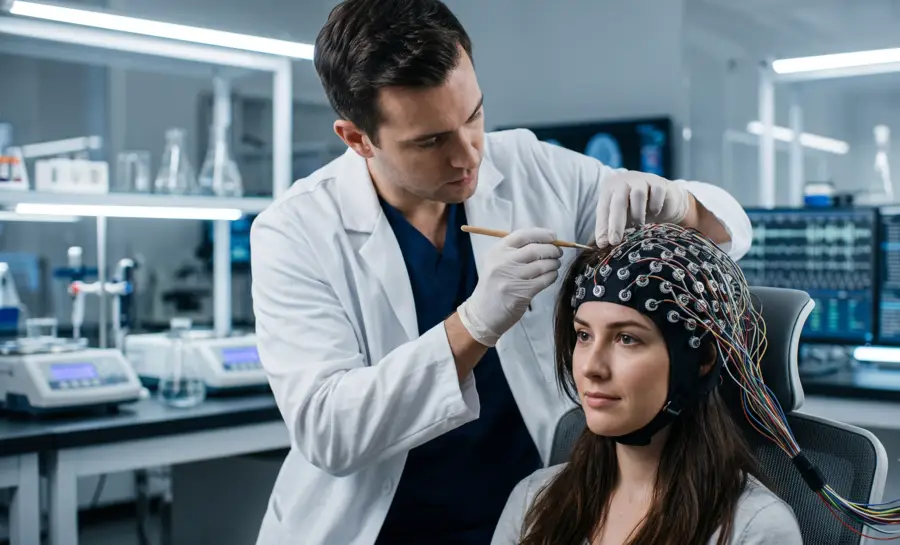
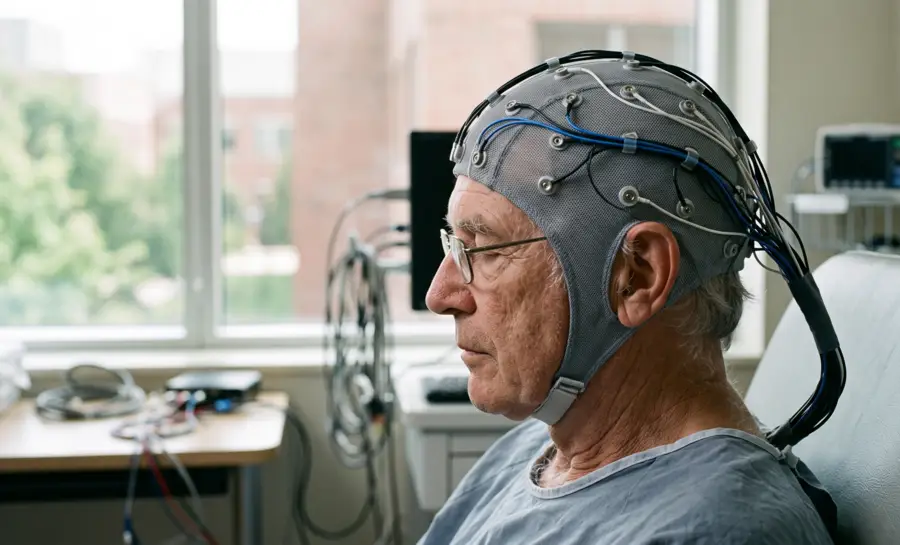
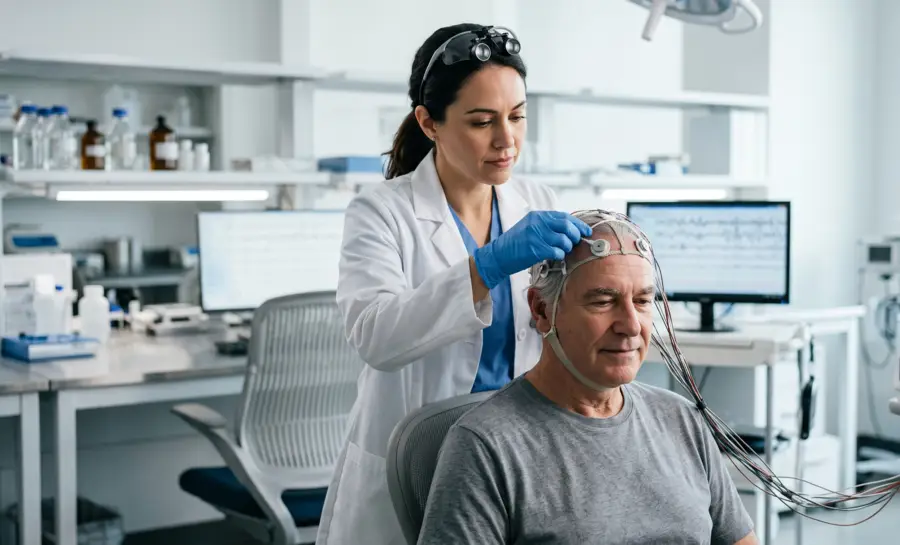
Every electroencephalogram, or EEG, works from the same basic premise: electrical activity generated inside the brain travels outward through tissue, skull, and scalp, where it can be picked up by sensors placed on the head's surface. The accuracy of that reading depends heavily on how many sensors you use and where you put them.
The 10-5 electrode system exists to answer that placement question with mathematical precision, offering researchers and clinicians a standardized map with more than 300 possible recording sites. This is a dramatic increase from the 21 positions used in the original 10-20 system that has anchored clinical EEG since the 1950s.
What Is the 10-5 System?
The 10-5 system is the third and most refined stage in a lineage of electrode placement standards. It began with the 10-20 system, a scheme built around dividing the head into measured percentage-based intervals so that electrode positions would stay consistent across different head sizes and different labs.
As EEG research demanded finer detail, particularly for tasks like distinguishing between neighboring brain regions, the 10-10 system emerged. It doubled the electrode count by adding points halfway between the original 10-20 locations, yielding around 74 sites.
The 10-5 system takes that same halving logic one step further. It subdivides the 10-10 intervals again, producing over 300 named positions across the scalp.
The core idea is that instead of sampling brain electricity at scattered, widely spaced points, you build a dense, evenly distributed grid across the entire head surface. This does not replace the 10-20 or 10-10 systems so much as extend them.
Anatomical Landmarks and Coordinate Math of the 10-5 EEG System
Four landmarks anchor the entire system:
The nasion sits at the bridge of the nose, where the forehead meets the nasal bone.
The inion is the small bony bump felt at the base of the skull, at the back of the head.
The left and right preauricular points sit just in front of each ear, at the small depression above the cheekbone.
These four points are palpable on virtually every human skull, which is why they were chosen as the geometric foundation for the entire measurement system.
From these landmarks, technicians take a set of standard measurements:
Sagittal arc: measures from nasion to inion over the top of the head
Coronal arc: runs between the left and right preauricular points across the crown
Head circumference: wraps horizontally through all four primary landmarks
Each arc is divided into percentage-based segments to position electrodes
These fixed measurements ensure the grid adapts to any head size
Once these arcs are measured, the naming logic reveals itself through simple division. The 10-20 system splits each arc into segments measured in percentages of the total arc length, generally in steps of 10% and 20%, which is where the system gets its name. This produces the classic 21-electrode layout still used in many standard clinical recordings. The 10-10 system takes each of those percentage intervals and cuts it in half, roughly doubling the resolution and pushing the total electrode count to approximately 74.
The 10-5 system repeats the halving process one more time, splitting the 10-10 intervals again. The result is a grid with over 300 positions, spaced roughly 2 to 3 centimeters apart on an average adult head.
The naming convention itself encodes location information directly into each electrode's label. Letters correspond to the underlying lobe of the brain: Fp for frontopolar, F for frontal, C for central, T for temporal, P for parietal, and O for occipital. Numbers, along with additional subscripts or prime marks in the denser 10-5 naming scheme, indicate how far that position sits from the midline as a fraction of the arc distance.
An electrode labeled with a low number sits closer to the center of the head, while higher numbers push toward the temples and ears. This means that once you understand the coding logic, an electrode's name alone tells you almost exactly where it sits on the scalp, without needing a diagram.
Improved Spatial Sampling: Why Denser Is Better
Brain electricity, as it reaches the scalp, behaves something like a signal made up of many overlapping spatial patterns of varying scale.
Some patterns are broad and smooth, spreading gently across large regions of the head. Others are much tighter, changing sharply from one small patch of scalp to the next.
To capture the full picture without missing anything, sensors need to be placed close enough together to detect the smallest of these spatial patterns. If sensors are spaced too far apart, fine-grained detail gets missed entirely or, worse, misread as something it is not. This general sampling problem is known in signal processing as the Nyquist criterion, and it is the underlying reason electrode density matters at all.
Standard 10-20 spacing places electrodes roughly 6 to 7 centimeters apart on an average adult head. That gap is wide enough to blur or entirely miss finer spatial patterns in the underlying electrical field. The 10-5 system's 2 to 3 centimeter spacing pushes much closer to the spatial sampling rate needed to resolve those finer patterns, approaching what is often called the spatial Nyquist limit for scalp-recorded EEG.
Direct evidence for the benefit of tighter spacing can be seen in Robinson et al. study comparing what researchers termed “super-Nyquist density” arrays against standard “Nyquist density” arrays.
Using 128 electrodes spaced just 14 millimeters apart over the occipitotemporal region, the back and side portions of the brain associated with visual processing, researchers recorded EEG while participants viewed flickering checkerboard patterns designed to produce a distinct, trackable brain response. When they compared the full high-density array against sparser subsets of the same electrodes, the denser array consistently outperformed the sparser one.
The authors reported that “SND EEG captured more neural information from visual cortex,” and that the flickering stimuli were “classified more accurately with SND than ND arrays in both the time and the frequency domains.” The denser recordings also aligned more closely with a computational model of primary visual cortex activity than the sparser recordings did.
This finding was localized to one brain region rather than the whole head, but it demonstrates that a tighter electrode spacing can, in principle, capture spatial and temporal features of cortical activity that wider spacing simply cannot resolve.
Source Localization Depends on Sensor Density and Coverage
Recording a signal densely is only half the challenge. Clinicians and researchers frequently want to work backward from scalp recordings to estimate where inside the brain a signal originated, a process called source localization. This reverse-engineering problem is mathematically difficult, and its accuracy depends directly on how much surface data feeds into it.
A simulation-based study focused specifically on this question examined how sensor density and head coverage affect the accuracy of source localization estimates. Using both simulated data and real epileptiform EEG recordings, meaning brain activity patterns associated with seizure-related electrical discharges, the researchers tested several common inverse modeling techniques across different source depths.
The results were direct: “Greater sensor density improves source localization accuracy.”
Just as important, the study found that coverage mattered independently of density. Adding electrode samples over the inferior surface, the lower portions of the head near the ears, temples, and base of the skull, “improves the accuracy of source estimates at all depths,” not just for sources located near that lower region.
The study's overall conclusion reinforces both findings together: “The most accurate source localization is obtained when the voltage surface is densely sampled over both the superior and inferior surfaces.”
This is a meaningful detail because standard 10-20 caps tend to concentrate coverage over the top of the head, leaving the lower scalp regions relatively sparse. A full 10-5 array inherently addresses both requirements at once, since its coordinate system extends coverage down toward the inferior surface while simultaneously packing in the density needed for finer localization.
Applications of High-Density EEG
Broadly, the adoption of high-density layouts has expanded the capabilities of both laboratory and bedside observations. By enabling precise triangulation of electrical wave propagation, these systems help researchers understand the rapid shifts in neural firing patterns that define cognition.
Neurological Research and Diagnostics
In the field of neuroscience, the drive for precision often dictates the methodology. High-density arrays allow for the detection of subtle topographical changes that occur during cognitive tasks, providing researchers evidence of how neural networks organize under specific stimulus conditions.
These arrays effectively map electrical pathways, assisting in the development of models that explain how distant brain regions coordinate through synchronized oscillations.
Brain-Computer Interfaces (BCIs)
BCI applications require continuous and stable detection of command-driven thought patterns. By utilizing an increased number of sensors, BCI developers can isolate specific motor-related signal components from generalized background interference.
This refinement in signal isolation leads to improved control accuracy in external prosthetic devices and digital communication tools, as the system can discern smaller, more localized motor intent signatures.
Clinical Applications and Monitoring with the High-Density EEG Cap
Within clinical settings, high-density caps are employed to measure seizure focuses with improved accuracy. In some cases, clinicians must assess the stability of electrical states using methodologies described in referential montage EEG guidelines.
A well-placed high-density cap allows for a more nuanced interpretation of these referential signals, helping clinicians pinpoint the source of abnormal activity in individuals presenting with focal epilepsy or cognitive processing disorders.
Comparing High-Density EEG Devices for Neuroscience Studies
When conducting a study, it is often necessary to evaluate which sampling density offers the best trade-off between acquisition complexity and the required scientific fidelity. The following table illustrates the general differences in electrode sampling density across common experimental configurations.
System Type | Electrode Count | Typical Spatial Resolution | Best Used For |
|---|---|---|---|
10-20 Standard | 21-32 | 6-8 cm | Routine monitoring |
Mid-Range | 64-128 | 3-4 cm | Clinical screening |
Full High-Density | 256+ | \< 2 cm | Source localization research |
This comparison highlights why researchers prioritizing spatial detail often gravitate toward full high-density arrays for complex localization studies. By minimizing the gaps between sensors, the data becomes more amenable to advanced mathematical modeling, allowing for the precise differentiation of cortical sources that might otherwise overlap in lower-resolution recordings.
Can High-Density EEG Detect Subcortical Activity?
One of the more debated claims about dense EEG arrays is whether they can pick up signals from structures deep inside the brain, well below the cortex, where standard EEG is traditionally assumed to have little sensitivity. Therefore, a 2019 research study addressing this question directly compared high-density scalp EEG against intracranial recordings taken from deep brain stimulation electrodes implanted in the centromedial thalamus and the nucleus accumbens, two structures involved in coordinating activity across broader brain networks.
Because the deep brain stimulation electrodes in this study were temporarily externalized, meaning accessible for recording before being connected to their permanent internal stimulator, researchers were able to record from these deep intracranial sites at the same time as a 256-channel high-density scalp EEG, in three patients during a resting state with eyes closed. They then applied source reconstruction techniques to the scalp data and compared the resulting signals against the actual intracranial recordings.
The results showed a correlation between alpha envelopes derived from intracranial and EEG source reconstructed brain signals, referring to the slow rise-and-fall pattern of alpha-band brain rhythms. Notably, “the highest correlation was found for source signals in close proximity to the actual recording sites,” meaning the scalp-based estimate was most accurate specifically at the depth and location matching the true intracranial electrode placement. The researchers concluded that this provides evidence that a scalp EEG indeed can sense subcortical signals.
However, this should be read as a small proof-of-concept demonstration in three patients during one behavioral state. It supports the idea that dense-array source imaging can extend sensitivity beyond the cortical surface, but it does not establish how reliable or reproducible that sensitivity is across broader populations or conditions.
Applying Dense Arrays to Epileptiform Discharge Mapping
The clinical case for the 10-5 system sharpens considerably in the context of epilepsy evaluation, where identifying the precise origin of abnormal electrical discharges can shape decisions about surgical treatment. The simulation-based source localization study referenced earlier explicitly extended its simulation findings into real epileptiform EEG data, examining the effects of sensor density and coverage in the source localization of epileptiform EEG.
Because the study's broader finding was that higher sensor density and inferior surface coverage both independently improve source estimate accuracy, and because this held true when tested against actual epileptiform recordings rather than simulated data alone, it provides a direct evidentiary bridge to the 10-5 system's clinical use case.
In presurgical epilepsy evaluation, this translates into a more precise delineation of the irritative zone, the region of cortex generating abnormal discharges between seizures, which can inform decisions about whether and where invasive monitoring or surgery might proceed. This benefit is frequently discussed in clinical and research circles as a primary justification for using 10-5 or comparably dense EEG montages in epilepsy centers.
The Future of High-Density EEG
Future advancements in high-density recording technology will likely center on the miniaturization of electrode components. As hardware becomes less cumbersome, researchers will be able to perform high-resolution recordings in mobile, real-world environments more easily. This portability will transition high-density acquisition from static laboratory settings into ambulatory contexts where human behavior can be studied in natural conditions without the limitations of traditional, bulky electrode setups.
Concurrently, the integration of real-time machine learning algorithms will shift the way raw data is processed. Rather than relying on retroactive analysis, modern systems are being engineered to decode neural activity on the fly with minimal latency. This capability will provide immediate feedback for neurorehabilitation protocols and adaptive BCI pathways, enabling the system to adjust its signal processing parameters based on the specific electrical characteristics of the individual being recorded.
Finally, the development of dry-electrode materials that maintain low impedance will further revolutionize these systems. By removing the need for conductive gels, the setup time for high-density caps will decrease from hours to mere minutes, significantly lowering the barrier for long-term monitoring.
This shift towards rapid-application hardware promises to make dense-array brain imaging a common practice in both clinical diagnostics and longitudinal cognitive research, fundamentally changing our understanding of human neural connectivity.
Conclusion
The 10-5 system provides a standardized coordinate framework built entirely from measurable anatomical landmarks, extending the familiar 10-20 and 10-10 systems into a grid of over 300 electrode positions spaced roughly 2 to 3 centimeters apart. That density brings scalp EEG recording much closer to the spatial resolution needed to capture fine-grained electrical patterns generated across the brain's surface, a principle rooted in general neuroscience and signal processing theory.
The evidence discussed suggests that denser sampling combined with inferior surface coverage improves source localization accuracy in both simulated and real epileptiform data. High-density arrays paired with source reconstruction techniques have shown a measurable, if preliminary, ability to correlate with subcortical activity recorded directly from deep brain structures. Very high-density recordings over the visual cortex captured more usable neural information than standard-density subsets of the same array.
Together, these findings build a reasonable theoretical and early empirical case for the 10-5 system's value in tasks like epileptiform discharge mapping and fine-grained cognitive neuroimaging.
References
Robinson, A. K., Venkatesh, P., Boring, M. J., Tarr, M. J., Grover, P., & Behrmann, M. (2017). Very high density EEG elucidates spatiotemporal aspects of early visual processing. Scientific reports, 7(1), 16248. https://doi.org/10.1038/s41598-017-16377-3
Song, J., Davey, C., Poulsen, C., Luu, P., Turovets, S., Anderson, E., ... & Tucker, D. (2015). EEG source localization: Sensor density and head surface coverage. Journal of neuroscience methods, 256, 9-21. https://doi.org/10.1016/j.jneumeth.2015.08.015
Seeber, M., Cantonas, L. M., Hoevels, M., Sesia, T., Visser-Vandewalle, V., & Michel, C. M. (2019). Subcortical electrophysiological activity is detectable with high-density EEG source imaging. Nature communications, 10(1), 753. https://doi.org/10.1038/s41467-019-08725-w
Frequently Asked Questions
What is the 10-5 EEG system?
The 10-5 system is a standardized electrode placement grid that subdivides the scalp into over 300 named positions, spaced roughly a few centimeters apart. It extends the older 10-20 and 10-10 systems to provide much denser sampling of brain electrical activity.
How does the 10-5 system build on the 10-20 system?
The 10-20 system divides the head using percentage-based intervals to define 21 standard positions. The 10-10 system halves those intervals, and the 10-5 system halves them again, creating a much finer grid while keeping all original landmarks.
What anatomical landmarks anchor the electrode placement?
Four palpable points—the nasion at the nose bridge, the inion at the skull base, and the left and right preauricular points in front of the ears—serve as fixed reference points. All electrode positions are calculated from arcs measured between these landmarks.
Why is denser electrode spacing important for EEG?
Brain electrical patterns can vary over small scalp areas, and widely spaced electrodes may miss fine details because of the Nyquist sampling principle. Denser spacing captures these smaller spatial patterns, leading to more accurate recordings.
How does the 10-5 system improve source localization?
Source localization estimates where inside the brain a signal originates, and its accuracy depends on having many measurement points. Denser sampling combined with coverage over the lower head improves the precision of these estimates at all brain depths.
Can dense-array EEG detect signals from deep brain structures?
A small study recorded simultaneously from scalp and implanted deep brain electrodes, showing a correlation between the two signals. This provides direct evidence that scalp EEG can sense subcortical activity, though broader validation is still needed.
Does higher electrode density always improve recording quality?
Increased density provides more data for spatial modeling, but it also elevates the complexity of data processing and the risk of impedance issues; quality depends on proper application and clear signal management.
Are there specific challenges with high-density caps?
The primary challenge is the application time for larger arrays and the increased computational workload required to process hundreds of channels simultaneously for clean modeling.
Emotiv is a neurotechnology leader helping advance neuroscience research through accessible EEG and brain data tools.
Christian Burgos