Challenge your memory! Play the new N-Back game in the Emotiv App
Challenge your memory! Play the new N-Back game in the Emotiv App
Challenge your memory! Play the new N-Back game in the Emotiv App
How to conduct real-world neuroscience research at scale: A case study using EmotivLABS.
Quoc Minh Lai
Share:


Dr Nikolas Williams,
EMOTIV Research Scientist.
When you think of neuroscience research, you likely conjure images of white-coat-clad scientists running big, expensive medical machines at a university or hospital. Certainly some neuroscience methods, such as positron emission tomography (PET), functional magnetic resonance imaging (fMRI), and magnetoencephalography (MEG), require these large, complex systems that are accompanied by similarly large price tags. Electroencephalography (EEG) systems, however, are generally smaller and less expensive. The technology has evolved from paper recordings and big computers to wireless, mobile, easy-to-set-up, and relatively inexpensive systems. In addition to the smaller footprint and financial outlay, EEG has emerged as a leading instrument for decoding brain activity due to its high temporal resolution. Whereas PET and fMRI measure changes in brain activity over seconds, EEG is able to detect changes in activity that occur in milliseconds, making it capable of indexing processes that may otherwise go undetected.
What does EEG measure?
When your neurons fire, they release tiny amounts of electricity. When many neurons all fire in the same area, such as when you think about something, the resulting electric field is detectable outside of the skull. EEG systems leverage this phenomenon by simply measuring the voltage changes across time using arrays of sensors placed on the scalp. You can think of these sensors like tiny microphones measuring the electrical sound from your brain. We can then convert these signals to digital form, collect them on a computer, and process and analyze them to deduce meaningful patterns.
Why is EEG important?
Often, we cannot measure things simply by asking people or observing their behaviour. Even when we can ask them, people don’t report accurately. EEG allows us a window into the brain; a window that is unaffected by biases, attitudes, or beliefs. For example, if you ask somebody whether they feel relaxed, even if they are not they may be inclined to say yes because people often do not like to admit when they’re anxious.
By observing their EEG, a researcher may be able to determine that the person, contrary to their assertion, is in fact experiencing high arousal indicative of a non-relaxed state. In the laboratory, EEG is often used to measure low-level cognitive processes such as auditory or visual perception, which can help researchers better understand these processes or understand how ailments affect the brain. This type of technology is crucial for understanding phenomena that cannot be reported or likely to be misreported.
Why would we do EEG outside of the lab?
EEG technology is an excellent technology for understanding brain processes. Much of the lab-based EEG research is geared toward investigating low-level functions such as perception and cognition. Labs are an ideal environment for this as they are highly controlled places in which researchers can account for and remove external variables. However, we do not spend our lives living inside of a lab. We are walking, talking, interacting beings that live dynamic lives characterised by rich and varied experience. This fact makes generalising lab studies to uncontrolled environments difficult. By taking the technology out of the lab, we can examine people and their brain activity in real-world environments that are closer to the way we actually live our lives.
Not too long ago, performing EEG experiments outside of the lab was unthinkable. The systems were large and were required to be tethered to amplifiers, power supplies, and data transmission units. In addition, setting up these systems was time-consuming and often uncomfortable for the participants. Major advances in technology have meant that systems could be built to be smaller, at lower cost, and wireless. Through this increased portability and decreased price tag, cost-effective and easy-to-use EEG systems have seen a marked proliferation. EMOTIV has been a leader in this space for over a decade, having brought the first commercially available EEG system to market. Over this time, EMOTIV has released six different systems that range from two-channel earphones to 32-channel research caps.
The development of these commercial systems have had another effect: Dramatically increased accessibility to neuroscience methods. No longer is neuroscience strictly for academics or clinicians. All people now have the means to purchase these systems for use in the home. The motivations for doing so are varied across demographics and include recreationalists, hobbyists, and citizen scientists. In addition, commercial enterprises are quickly taking notice of the ability to leverage these systems for deployment in their industries without the need for dedicated, in-house neuroscience departments.
What are the real-world applications of EEG?
EEG applications outside of the lab are numerous and diverse. As a clinical tool, EEG can be used to longitudinally monitor peoples’ cognitive function without requiring them to attend a facility. For example, research has supported EEG as a biomarker for dementia (Chatzikonstantinou et al., 2021). Further, it can even be used to predict the transition from mild cognitive impairment to dementia (Engedal et al., 2020). Consistent, at-home EEG would be particularly helpful in these populations which are predominantly composed of older adults for whom regular travel to a research facility may not be feasible.
Another topical example of an EEG application in the wild is the recent attention garnered by traumatic brain injury in sports. In high-impact sports, such as professional football, concussions are a common injury. Concussions are concerning as they often escape clinical detection and can have a pernicious impact on an individuals’ cognitive functioning. Evidence has supported the use of EEG to aid diagnosis of concussion and to support clinical management following injury (Corbin-Berrigan et al., 2020). Certainly, the presence of portable EEG on the sidelines would be a powerful tool for assisting teams in making good decisions regarding the welfare of their players.
Commercial enterprises also have much to gain from real-world EEG. Neuromarketing is a broad term but is generally associated with gaining insight into consumer preference and predicting behaviour by measuring neural or other physiological signals. The value of using EEG to investigate consumer desires lies in the method’s ability to index objective responses. Sometimes what people report is not actually how they feel as people are subject to a wide variety of biases. They can also have a strong desire to please others or to avoid embarrassment. Even the manner in which a question is phrased can affect how a person perceives a product. EEG allows researchers to circumvent these characteristics and provides an unfiltered glimpse into the manner in which an individual is processing information. By leveraging these data streams, companies can augment or replace traditional marketing tools.
What are some obstacles to real-world EEG?
Cost is perhaps the largest barrier to conducting real-world EEG experiments. Though less expensive than other brain-imaging tools, EEG systems can still be large and expensive. To make sense of the large quantity of data requires processing and analysis pipelines. The data sets must also be stored in a secure manner. This places in-house neuroscience out of reach for many smaller companies.
The cost of conducting real-world EEG is further compounded when considering one of the critical short-comings of human research: The issue of representative sampling. Many studies are constrained by the realities of participant recruitment that often defaults to one of convenience (e.g. university students). This results in much research being plagued by the “WEIRD” problem in which most participants are white, educated, from industrialized regions, rich, and reside in democracies. Simply moving EEG outside of the lab does not solve this problem and the burden of recruiting samples composed of people with differing cultures, education levels, interests, and experience can be financially and logistically prohibitive.
How can I conduct real-world EEG at scale?
Given the cost of conducting real-world EEG, many would assume that neuroscience studies would remain the domain of well-funded academic institutions and corporations. However, in addition to revolutionizing the landscape with portable, low-cost EEG systems, EMOTIV has launched the EmotivPRO Builder and EmotivLABS platforms that allow companies to design and conduct large-scale neuroscience experiments. EmotivPRO Builder is an intuitive, graphical interface that gives users complete control over an experiment and facilitates users of all abilities in designing EEG studies. The more technically savvy user can also import PsychoPy experiments written in the Python language.
After building an experiment, users can deploy them on EmotivLABS. This is not simply a presentation platform, but also streamlines participant recruitment through its dashboards and gives researchers access to the broad EMOTIV contributor pool. Participant payments can also be handled through the platform. The EMOTIV contributor pool currently hail from 84 countries. Nearly half are bilingual and include people with a wide range of educational backgrounds.
For those companies who are unsure how best to capitalize on the power of neuroscience, the EMOTIV Research as a Service team can be engaged to consult. The research team will identify the key questions, design an experiment, recruit participants, collect, process, and analyze the data, and produce personalized reports on the findings. Your input will be welcomed every step of the way. Your partnership with the EMOTIV research team represents a truly end-to-end solution for engaging with the neuroscience revolution.
To illustrate a specific use-case, we present a case study of a recent partnership below.
The Mentimeter Effect: A case study of real-world EEG using EmotivLABS
Mentimeter is a multimedia presentation software platform. Most people are familiar with Microsoft Powerpoint. Countless hours have been devoted to delivering Powerpoint presentations to which the audience plays a passive role. Mentimeter also allows users to convey information using text, images, audio, and video, but with a twist. Where Mentimeter differentiates itself is through its features that enable live, interactive audience engagement. In addition to the typical slides, presenters can include events with which the audience can interact using their personal devices. For example, audience members can vote on what content they would like to focus on in the presentation. Or perhaps they can give their opinion on a particular topic or answer quiz questions about what they have just viewed. In this way, Mentimeter allows more dynamic, lively presentations than Powerpoint.
Mentimeter knew that they had a special product and that people were likely to find it more engaging. However, they did not want to solely rely on subjective reports from their users. They wanted some objective, granular data that would showcase exactly what makes Mentimeter special. They approached EMOTIV to conduct a research project to find the answers to this. In conjunction with our research team, we identified key questions that would get at the heart of Mentimeter’s special sauce.
Key questions:
How much more engaging is a presentation on Mentimeter when compared to a more traditional powerpoint presentation?
Which of Mentimeter’s special features capture the most audience attention?
How is attention affected over the course of the presentation? Does it wane as would be expected over a long Powerpoint presentation?
What is the relationship between engagement and attention? Do people pay more attention when they are engaged?
Lectures and presentations are often about learning new information and retaining it. Does Mentimeter help us learn better?
To answer these questions, the EMOTIV research team devised a bespoke experiment. Typically this type of study would be done by gathering individuals into a room and collecting EEG data to a local computer while participants viewed a traditional presentation versus a Mentimeter presentation. Recruiting participants from a single area and gathering them into a confined space was not preferable for several reasons.
The first was simple logistics. To come to our location, participants would be required to travel, which could limit the number of volunteers. Likewise, recruiting participants from a single region could result in a sample that was non-representative. The second issue was one of public health. During the midst of a pandemic, EEG research was severely restricted due to the close interpersonal contact required to set up the systems. By organizing a remote study that harnessed the EMOTIV user-base and deploying it on the EmotivLABS platform, we were able to circumvent these issues. This allowed us to conduct a safe study that captured data from users across the world and leveraged EMOTIV’s sophisticated machine-learning algorithms to assess audience engagement, attention, interest, and cognitive stress in real time.
The Study
To evaluate the Mentimeter effect, we designed an experiment in which people watched two presentations; one done with Mentimeter and the other done with Powerpoint. While they watched the presentations, we remotely collected EEG data and assessed their brain activity across the domains of engagement, attention, interest, and cognitive stress. We also collected demographic data and self-report survey data.
Participants
Twenty-eight participants were recruited for the study from the EMOTIV customer base, online through email communications and online forms. This sample size was lower than we would have preferred. However, we were under a strict schedule for the project and so it is notable that we were able to recruit this number in a short time frame and is reflective of participant recruitment efficiency using EmotivLABS. With consent, demographic data was collected in order for Mentimeter to understand how these effects would influence a variety of people.
Participants from over 15 different countries were recruited, with ages ranging from 21 to 64. Online, worldwide recruitment also enabled us to capture a diverse range of educational levels, occupations, musical abilities, and expertise in the relevant topics. See Figures 1 -3 for participant characteristics.
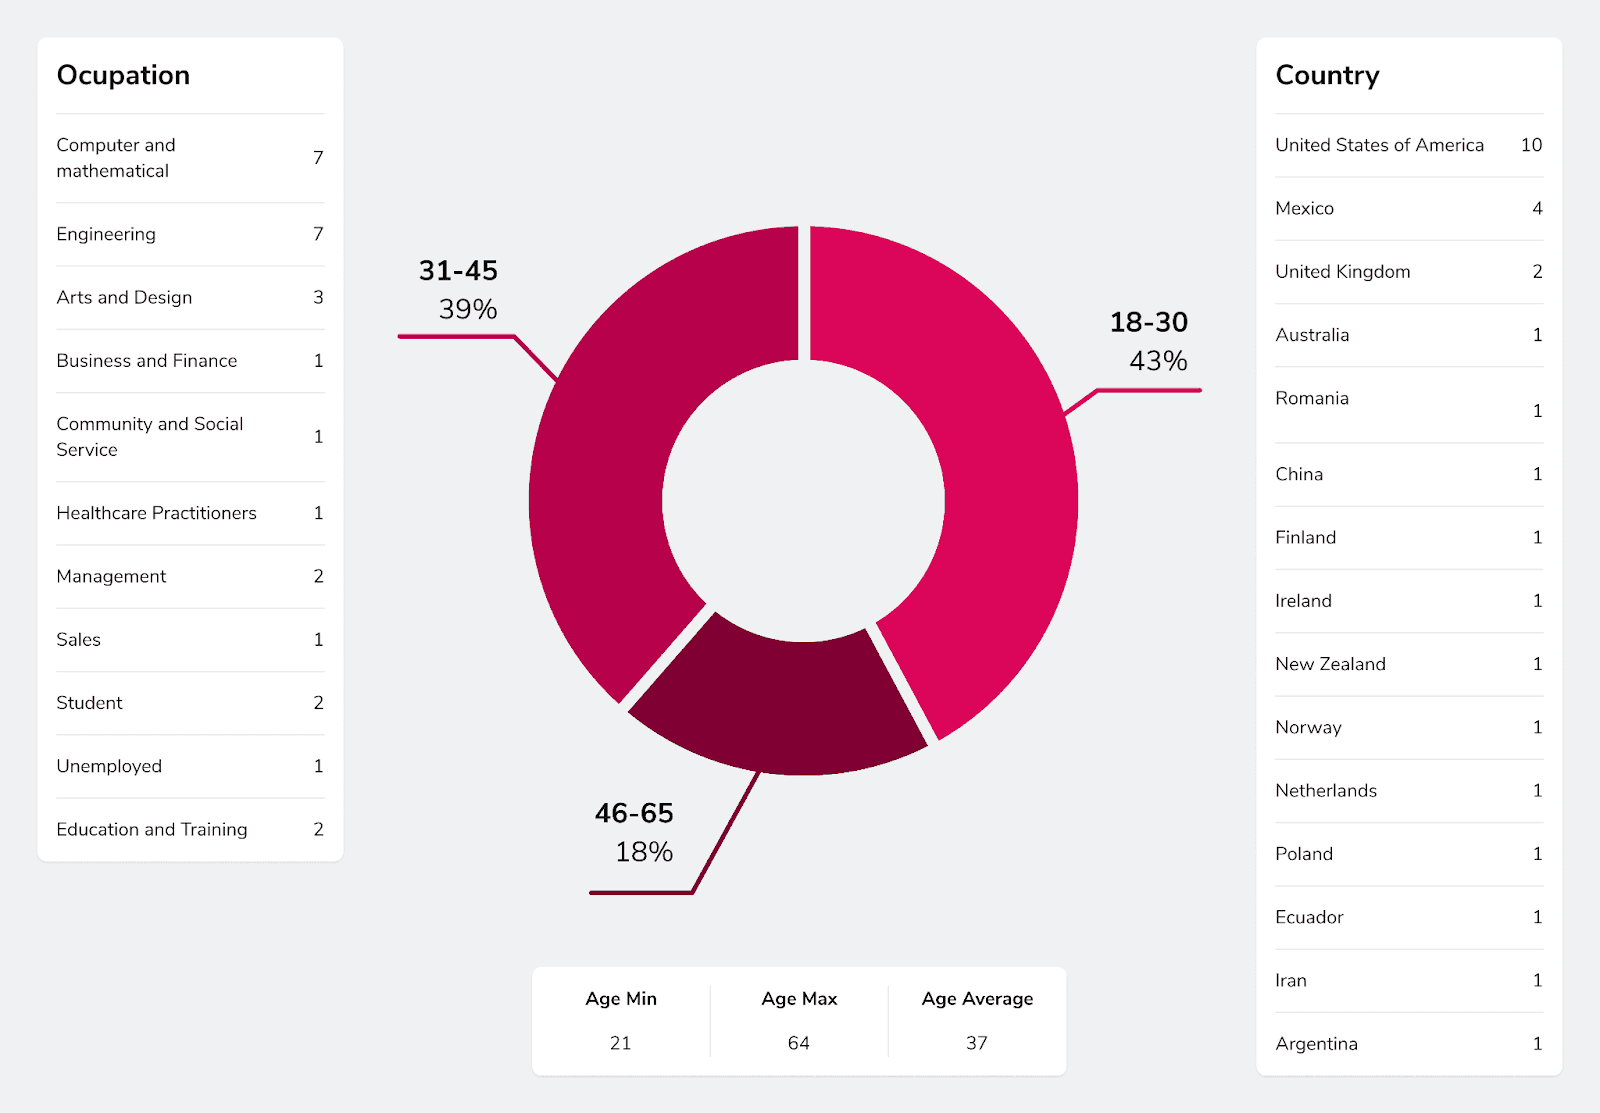
Figure 1. Participant demographics.

Figure 2. Participant education level and musical ability.

Figure 3. Self-reporting ratings of knowledge on topics.
Method
A recruitment survey was sent out via email to the EMOTIV customer base to anyone that might be interested in participating in an online study. Using videoconferencing software, we began with an orientation session in which we explained to participants the basics of how the experiment would be conducted. All participants set up their EMOTIV EPOC, EPOC+ or EPOCX (https://www.emotiv.com/epoc-x/) prior to the call and after a quick data quality check by Emotiv’s Director of Research, the EmotivLABS software automatically tracked their signal quality throughout the recording.
The entire experiment was built using the EMOTIV web-platform experiment builder (https://www.emotiv.com/emotivpro/build/). The EmotivLABS platform guided the participants through the baseline (sitting quietly with eyes open and eyes closed), a few questionnaires to establish if there was anything that might affect the EEG on the day, and then prompted them to begin their first presentation. A Mentimeter representative, Oscar, presented a webinar on one of 2 topics. One presentation was done with Mentimeter and the other with Powerpoint. The presentations also had different content; one was “The Harmonic Series” and the other was “Artificial Intelligence in Music”. We counter-balanced these presentation conditions to ensure that any effects were not attributed to the content, but instead to the software used (see Figure 4).

Figure 4. Counterbalanced conditions for each group.
Following the second presentation, participants completed the questionnaire and then we collected a final session of baseline EEG. See Figure 5 for an overview of the protocol.

Figure 5. Experiment overview.
Emotiv Performance Metrics
EMOTIV Performance Metrics (PM) are neurophysiological measures of cognitive and affective states. They are proprietary machine learning algorithms providing real-time values of aggregated electroencephalography (EEG) measures; variant brainwave amplitudes, spatial distributions, powers and frequencies of neurons firing in the brain.
EEG data from hundreds of individuals in controlled psychological experiments and real-life settings has been collected and used to build these algorithms. Each of the performance metrics is scaled and tailored to the individual user based on their own “range” of brain activity (see Figure 6 for an overview of the PM’s used in this study).

Figure 6. Overview of EMOTIV Performance Metrics
Findings
Mentimeter vs Powerpoint: Overall PM patterns
We first examined group-level brain activity across each of the presentations as a whole. Figure 7 shows the average of each PM for Mentimeter presentations and Powerpoint presentations. Compared to Powerpoint, individuals showed statistically significant lower levels of boredom, and higher levels of engagement, attention, and cognitive load. There was no statistical difference in interest levels; however the numerical trend leaned toward more interest in the Mentimeter presentation.

Figure 7. Average PM across the entire presentation compared by the presentation platform.
We then looked at how individuals responded over each of the presentations. In Figure 8, “wider” shapes indicate more individual PM observations at that value and “skinnier” shapes indicate fewer PM observations at that value. These patterns suggested that the Mentimeter presentations evoked more homogenous responses than did Powerpoint. In other words, people responded similarly to Mentimeter but found Powerpoint more polarising.

Figure 8. Individual average PM distributions compared by presentation platform.
Mentimeter vs Powerpoint: PMs across time
To get a sense of how people responded over the course of the presentation, we calculated average group PM values across each slide for each of the platforms (Mentimeter vs Powerpoint) and each of the content (AI vs Harmonics). Figure 9 shows the most notable patterns.

Figure 9. Time-course of PMs across slides.
For the AI content, boredom levels were lower across the entire presentation. We observed an interesting Boredom pattern in the Harmonics content, where boredom rose towards the middle of the presentation and then fell towards. This suggested that the unique, engaging nature of Mentimeter “events” helped alleviate mounting boredom that may occur over the course of a presentation.
We observed engagement levels that were higher for Mentimeter across both types of content for almost the entire presentation. Of the 24 total slides, there were only two instances in which Mentimeter engagement was not higher than Powerpoint.
The Mentimer effect: Comparing Mentimeter events to Powerpoint slides
While overall we found that people responded positively to Mentimeter , we wanted to dig deeper and see how the specific Mentimeter events compared to the Powerpoint slides. Mentimeter events are instances in which the audience is encouraged to interact with the presentation using their mobile devices. For example, participants may have been asked about their individual opinion on a topic or they were asked to answer a quiz question related to the presentation. Figure 10 shows the average PM observed for Mentimeter events and Powerpoint slides.

Figure 10. Comparison of PM values for Mentimeter events and Powerpoint slides.
We observed that, relative to Powerpoint slides, Mentimeter events resulted in lower boredom and higher engagement, attention, interest, and cognitive load. The biggest effects were for boredom and engagement levels, which saw a 16% reduction and 13% increase, respectively.
The Mentimeter effect: How do the different Mentimeter events compare?
While Mentimeter events generally evoked positive responses in the audience, we wanted to know if some events were better than others. The Mentimeter presentations contained three types of events: Opinion events, in which the audience was asked their opinion on a topic; Quiz events, in which the audience was asked questions regarding the content of the presentation; and video events, in which participants viewed a video. Figure 11 shows PM values for each of the event types. We also included Powerpoint slides as a comparison.

Figure 11. Mean PM for each Mentimeter event type. Mean PM for Powerpoint slide included for comparison.
Opinion events showed the most consistent effect by eliciting the least amount of boredom and most amount of engagement, attention, interest, and cognitive load relative to the other events. Interestingly, video events tended to evoke the most boredom and least engagement and attention.
The Mentimeter effect: A closer look at engagement
Although all the PM trended toward positive response to Mentimeter presentations, engagement appeared to have the most consistent effect. To take a closer look, we indexed the point at which each participant demonstrated their maximum engagement PM. Figure 12 shows that a greater number of maximum engagement values occurred during the Mentimeter presentation. In addition, 70% of participants’ maximum engagement scores occurred during a Mentimeter event.
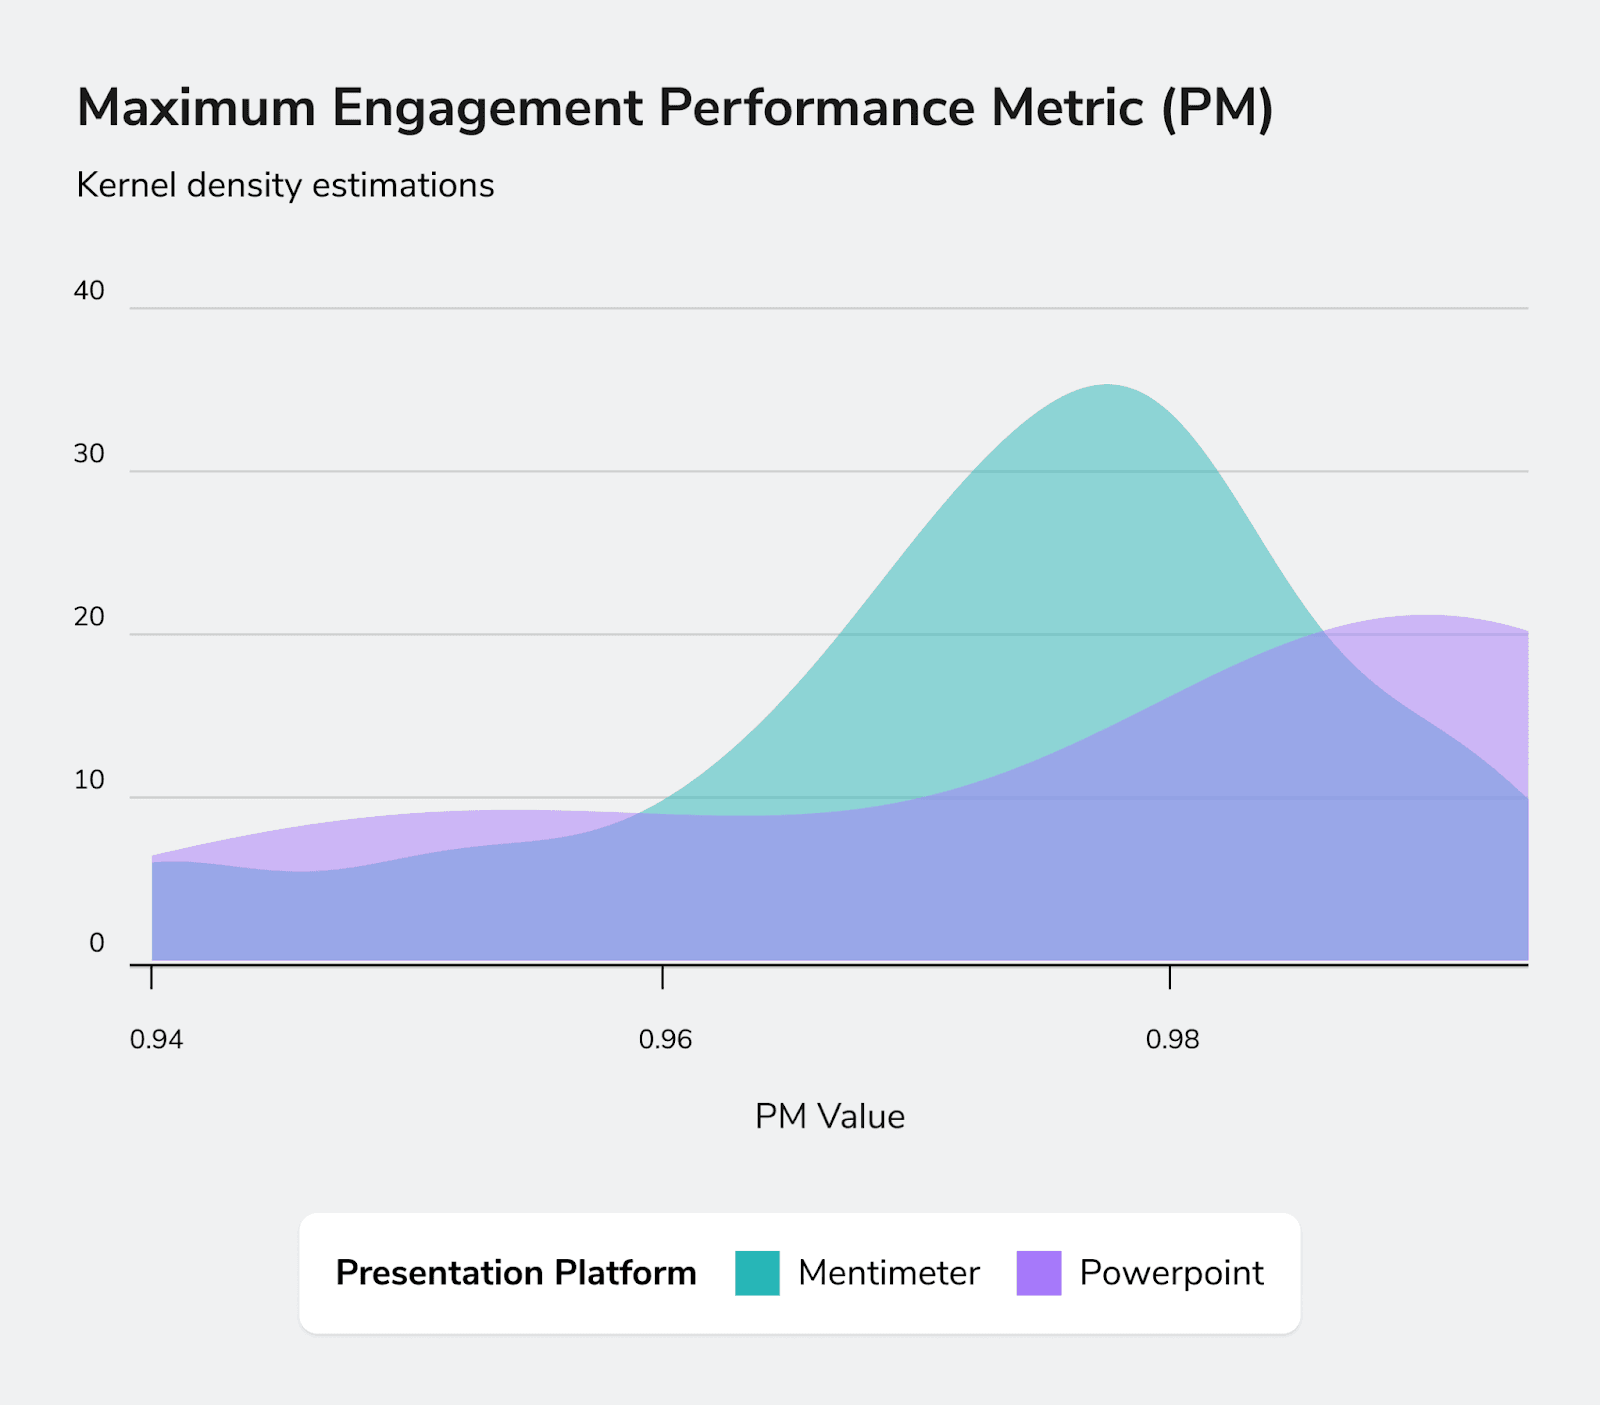
Figure 12. Distribution of maximum engagement PM.
The Mentimeter effect: Comparing objective and subjective measures
While EEG can index objective responses to stimuli, instances in which these measures bolstered by self-reports provide compelling evidence for effects. Figure 13 shows subjective engagement scores for the five engagement-related questions presented at the end of the experiment.

Figure 13. Subjective engagement scores as reported by participants on a 1-5 Likert Scale “Not at all” to “Extremely”.
Responses to all questions supported findings from the brain data. Relative to Powerpoint presentations, Mentimeter presentations resulted in participants feeling more engaged with presentations, more engaged with the presenter, more interested in the content, experienced more enjoyment of the presentation, and feeling as though they had learned more novel content during the presentation.
Summary
At the conclusion of the study, the EMOTIV research team delivered a detailed report on the findings to Mentimeter. This enabled Mentimeter to better understand their product and what made it such a positive experience for their users. Not only was Mentimeter given empirical data that demonstrated that their product elicited higher engagement, attention, cognitive load while also lowering boredom, it provided actionable insights into which of their special features were most engaging with users. The Mentimeter write up on the study findings can be found at https://www.mentimeter.com/campaigns/the-mentimeter-effect?
Studies like the Mentimeter Effect represent only a tiny fraction of the possibilities for remote, streamlined, and personalized EEG experiments. From evaluating consumer preference to investigating mental health issues, the EMOTIV research suite is the ideal platform for scalable EEG research. In collaboration with our research team, individuals, companies, and institutions can harness the power of neuroscience to gain insight into the human population. This solution represents the ideal answer to modern neuroscience that is immune to public health crises, resistant to shrinking budgets, and broadly inclusive of a global community.
Dr Nikolas Williams,
EMOTIV Research Scientist.
When you think of neuroscience research, you likely conjure images of white-coat-clad scientists running big, expensive medical machines at a university or hospital. Certainly some neuroscience methods, such as positron emission tomography (PET), functional magnetic resonance imaging (fMRI), and magnetoencephalography (MEG), require these large, complex systems that are accompanied by similarly large price tags. Electroencephalography (EEG) systems, however, are generally smaller and less expensive. The technology has evolved from paper recordings and big computers to wireless, mobile, easy-to-set-up, and relatively inexpensive systems. In addition to the smaller footprint and financial outlay, EEG has emerged as a leading instrument for decoding brain activity due to its high temporal resolution. Whereas PET and fMRI measure changes in brain activity over seconds, EEG is able to detect changes in activity that occur in milliseconds, making it capable of indexing processes that may otherwise go undetected.
What does EEG measure?
When your neurons fire, they release tiny amounts of electricity. When many neurons all fire in the same area, such as when you think about something, the resulting electric field is detectable outside of the skull. EEG systems leverage this phenomenon by simply measuring the voltage changes across time using arrays of sensors placed on the scalp. You can think of these sensors like tiny microphones measuring the electrical sound from your brain. We can then convert these signals to digital form, collect them on a computer, and process and analyze them to deduce meaningful patterns.
Why is EEG important?
Often, we cannot measure things simply by asking people or observing their behaviour. Even when we can ask them, people don’t report accurately. EEG allows us a window into the brain; a window that is unaffected by biases, attitudes, or beliefs. For example, if you ask somebody whether they feel relaxed, even if they are not they may be inclined to say yes because people often do not like to admit when they’re anxious.
By observing their EEG, a researcher may be able to determine that the person, contrary to their assertion, is in fact experiencing high arousal indicative of a non-relaxed state. In the laboratory, EEG is often used to measure low-level cognitive processes such as auditory or visual perception, which can help researchers better understand these processes or understand how ailments affect the brain. This type of technology is crucial for understanding phenomena that cannot be reported or likely to be misreported.
Why would we do EEG outside of the lab?
EEG technology is an excellent technology for understanding brain processes. Much of the lab-based EEG research is geared toward investigating low-level functions such as perception and cognition. Labs are an ideal environment for this as they are highly controlled places in which researchers can account for and remove external variables. However, we do not spend our lives living inside of a lab. We are walking, talking, interacting beings that live dynamic lives characterised by rich and varied experience. This fact makes generalising lab studies to uncontrolled environments difficult. By taking the technology out of the lab, we can examine people and their brain activity in real-world environments that are closer to the way we actually live our lives.
Not too long ago, performing EEG experiments outside of the lab was unthinkable. The systems were large and were required to be tethered to amplifiers, power supplies, and data transmission units. In addition, setting up these systems was time-consuming and often uncomfortable for the participants. Major advances in technology have meant that systems could be built to be smaller, at lower cost, and wireless. Through this increased portability and decreased price tag, cost-effective and easy-to-use EEG systems have seen a marked proliferation. EMOTIV has been a leader in this space for over a decade, having brought the first commercially available EEG system to market. Over this time, EMOTIV has released six different systems that range from two-channel earphones to 32-channel research caps.
The development of these commercial systems have had another effect: Dramatically increased accessibility to neuroscience methods. No longer is neuroscience strictly for academics or clinicians. All people now have the means to purchase these systems for use in the home. The motivations for doing so are varied across demographics and include recreationalists, hobbyists, and citizen scientists. In addition, commercial enterprises are quickly taking notice of the ability to leverage these systems for deployment in their industries without the need for dedicated, in-house neuroscience departments.
What are the real-world applications of EEG?
EEG applications outside of the lab are numerous and diverse. As a clinical tool, EEG can be used to longitudinally monitor peoples’ cognitive function without requiring them to attend a facility. For example, research has supported EEG as a biomarker for dementia (Chatzikonstantinou et al., 2021). Further, it can even be used to predict the transition from mild cognitive impairment to dementia (Engedal et al., 2020). Consistent, at-home EEG would be particularly helpful in these populations which are predominantly composed of older adults for whom regular travel to a research facility may not be feasible.
Another topical example of an EEG application in the wild is the recent attention garnered by traumatic brain injury in sports. In high-impact sports, such as professional football, concussions are a common injury. Concussions are concerning as they often escape clinical detection and can have a pernicious impact on an individuals’ cognitive functioning. Evidence has supported the use of EEG to aid diagnosis of concussion and to support clinical management following injury (Corbin-Berrigan et al., 2020). Certainly, the presence of portable EEG on the sidelines would be a powerful tool for assisting teams in making good decisions regarding the welfare of their players.
Commercial enterprises also have much to gain from real-world EEG. Neuromarketing is a broad term but is generally associated with gaining insight into consumer preference and predicting behaviour by measuring neural or other physiological signals. The value of using EEG to investigate consumer desires lies in the method’s ability to index objective responses. Sometimes what people report is not actually how they feel as people are subject to a wide variety of biases. They can also have a strong desire to please others or to avoid embarrassment. Even the manner in which a question is phrased can affect how a person perceives a product. EEG allows researchers to circumvent these characteristics and provides an unfiltered glimpse into the manner in which an individual is processing information. By leveraging these data streams, companies can augment or replace traditional marketing tools.
What are some obstacles to real-world EEG?
Cost is perhaps the largest barrier to conducting real-world EEG experiments. Though less expensive than other brain-imaging tools, EEG systems can still be large and expensive. To make sense of the large quantity of data requires processing and analysis pipelines. The data sets must also be stored in a secure manner. This places in-house neuroscience out of reach for many smaller companies.
The cost of conducting real-world EEG is further compounded when considering one of the critical short-comings of human research: The issue of representative sampling. Many studies are constrained by the realities of participant recruitment that often defaults to one of convenience (e.g. university students). This results in much research being plagued by the “WEIRD” problem in which most participants are white, educated, from industrialized regions, rich, and reside in democracies. Simply moving EEG outside of the lab does not solve this problem and the burden of recruiting samples composed of people with differing cultures, education levels, interests, and experience can be financially and logistically prohibitive.
How can I conduct real-world EEG at scale?
Given the cost of conducting real-world EEG, many would assume that neuroscience studies would remain the domain of well-funded academic institutions and corporations. However, in addition to revolutionizing the landscape with portable, low-cost EEG systems, EMOTIV has launched the EmotivPRO Builder and EmotivLABS platforms that allow companies to design and conduct large-scale neuroscience experiments. EmotivPRO Builder is an intuitive, graphical interface that gives users complete control over an experiment and facilitates users of all abilities in designing EEG studies. The more technically savvy user can also import PsychoPy experiments written in the Python language.
After building an experiment, users can deploy them on EmotivLABS. This is not simply a presentation platform, but also streamlines participant recruitment through its dashboards and gives researchers access to the broad EMOTIV contributor pool. Participant payments can also be handled through the platform. The EMOTIV contributor pool currently hail from 84 countries. Nearly half are bilingual and include people with a wide range of educational backgrounds.
For those companies who are unsure how best to capitalize on the power of neuroscience, the EMOTIV Research as a Service team can be engaged to consult. The research team will identify the key questions, design an experiment, recruit participants, collect, process, and analyze the data, and produce personalized reports on the findings. Your input will be welcomed every step of the way. Your partnership with the EMOTIV research team represents a truly end-to-end solution for engaging with the neuroscience revolution.
To illustrate a specific use-case, we present a case study of a recent partnership below.
The Mentimeter Effect: A case study of real-world EEG using EmotivLABS
Mentimeter is a multimedia presentation software platform. Most people are familiar with Microsoft Powerpoint. Countless hours have been devoted to delivering Powerpoint presentations to which the audience plays a passive role. Mentimeter also allows users to convey information using text, images, audio, and video, but with a twist. Where Mentimeter differentiates itself is through its features that enable live, interactive audience engagement. In addition to the typical slides, presenters can include events with which the audience can interact using their personal devices. For example, audience members can vote on what content they would like to focus on in the presentation. Or perhaps they can give their opinion on a particular topic or answer quiz questions about what they have just viewed. In this way, Mentimeter allows more dynamic, lively presentations than Powerpoint.
Mentimeter knew that they had a special product and that people were likely to find it more engaging. However, they did not want to solely rely on subjective reports from their users. They wanted some objective, granular data that would showcase exactly what makes Mentimeter special. They approached EMOTIV to conduct a research project to find the answers to this. In conjunction with our research team, we identified key questions that would get at the heart of Mentimeter’s special sauce.
Key questions:
How much more engaging is a presentation on Mentimeter when compared to a more traditional powerpoint presentation?
Which of Mentimeter’s special features capture the most audience attention?
How is attention affected over the course of the presentation? Does it wane as would be expected over a long Powerpoint presentation?
What is the relationship between engagement and attention? Do people pay more attention when they are engaged?
Lectures and presentations are often about learning new information and retaining it. Does Mentimeter help us learn better?
To answer these questions, the EMOTIV research team devised a bespoke experiment. Typically this type of study would be done by gathering individuals into a room and collecting EEG data to a local computer while participants viewed a traditional presentation versus a Mentimeter presentation. Recruiting participants from a single area and gathering them into a confined space was not preferable for several reasons.
The first was simple logistics. To come to our location, participants would be required to travel, which could limit the number of volunteers. Likewise, recruiting participants from a single region could result in a sample that was non-representative. The second issue was one of public health. During the midst of a pandemic, EEG research was severely restricted due to the close interpersonal contact required to set up the systems. By organizing a remote study that harnessed the EMOTIV user-base and deploying it on the EmotivLABS platform, we were able to circumvent these issues. This allowed us to conduct a safe study that captured data from users across the world and leveraged EMOTIV’s sophisticated machine-learning algorithms to assess audience engagement, attention, interest, and cognitive stress in real time.
The Study
To evaluate the Mentimeter effect, we designed an experiment in which people watched two presentations; one done with Mentimeter and the other done with Powerpoint. While they watched the presentations, we remotely collected EEG data and assessed their brain activity across the domains of engagement, attention, interest, and cognitive stress. We also collected demographic data and self-report survey data.
Participants
Twenty-eight participants were recruited for the study from the EMOTIV customer base, online through email communications and online forms. This sample size was lower than we would have preferred. However, we were under a strict schedule for the project and so it is notable that we were able to recruit this number in a short time frame and is reflective of participant recruitment efficiency using EmotivLABS. With consent, demographic data was collected in order for Mentimeter to understand how these effects would influence a variety of people.
Participants from over 15 different countries were recruited, with ages ranging from 21 to 64. Online, worldwide recruitment also enabled us to capture a diverse range of educational levels, occupations, musical abilities, and expertise in the relevant topics. See Figures 1 -3 for participant characteristics.
Figure 1. Participant demographics.
Figure 2. Participant education level and musical ability.
Figure 3. Self-reporting ratings of knowledge on topics.
Method
A recruitment survey was sent out via email to the EMOTIV customer base to anyone that might be interested in participating in an online study. Using videoconferencing software, we began with an orientation session in which we explained to participants the basics of how the experiment would be conducted. All participants set up their EMOTIV EPOC, EPOC+ or EPOCX (https://www.emotiv.com/epoc-x/) prior to the call and after a quick data quality check by Emotiv’s Director of Research, the EmotivLABS software automatically tracked their signal quality throughout the recording.
The entire experiment was built using the EMOTIV web-platform experiment builder (https://www.emotiv.com/emotivpro/build/). The EmotivLABS platform guided the participants through the baseline (sitting quietly with eyes open and eyes closed), a few questionnaires to establish if there was anything that might affect the EEG on the day, and then prompted them to begin their first presentation. A Mentimeter representative, Oscar, presented a webinar on one of 2 topics. One presentation was done with Mentimeter and the other with Powerpoint. The presentations also had different content; one was “The Harmonic Series” and the other was “Artificial Intelligence in Music”. We counter-balanced these presentation conditions to ensure that any effects were not attributed to the content, but instead to the software used (see Figure 4).
Figure 4. Counterbalanced conditions for each group.
Following the second presentation, participants completed the questionnaire and then we collected a final session of baseline EEG. See Figure 5 for an overview of the protocol.
Figure 5. Experiment overview.
Emotiv Performance Metrics
EMOTIV Performance Metrics (PM) are neurophysiological measures of cognitive and affective states. They are proprietary machine learning algorithms providing real-time values of aggregated electroencephalography (EEG) measures; variant brainwave amplitudes, spatial distributions, powers and frequencies of neurons firing in the brain.
EEG data from hundreds of individuals in controlled psychological experiments and real-life settings has been collected and used to build these algorithms. Each of the performance metrics is scaled and tailored to the individual user based on their own “range” of brain activity (see Figure 6 for an overview of the PM’s used in this study).
Figure 6. Overview of EMOTIV Performance Metrics
Findings
Mentimeter vs Powerpoint: Overall PM patterns
We first examined group-level brain activity across each of the presentations as a whole. Figure 7 shows the average of each PM for Mentimeter presentations and Powerpoint presentations. Compared to Powerpoint, individuals showed statistically significant lower levels of boredom, and higher levels of engagement, attention, and cognitive load. There was no statistical difference in interest levels; however the numerical trend leaned toward more interest in the Mentimeter presentation.
Figure 7. Average PM across the entire presentation compared by the presentation platform.
We then looked at how individuals responded over each of the presentations. In Figure 8, “wider” shapes indicate more individual PM observations at that value and “skinnier” shapes indicate fewer PM observations at that value. These patterns suggested that the Mentimeter presentations evoked more homogenous responses than did Powerpoint. In other words, people responded similarly to Mentimeter but found Powerpoint more polarising.
Figure 8. Individual average PM distributions compared by presentation platform.
Mentimeter vs Powerpoint: PMs across time
To get a sense of how people responded over the course of the presentation, we calculated average group PM values across each slide for each of the platforms (Mentimeter vs Powerpoint) and each of the content (AI vs Harmonics). Figure 9 shows the most notable patterns.
Figure 9. Time-course of PMs across slides.
For the AI content, boredom levels were lower across the entire presentation. We observed an interesting Boredom pattern in the Harmonics content, where boredom rose towards the middle of the presentation and then fell towards. This suggested that the unique, engaging nature of Mentimeter “events” helped alleviate mounting boredom that may occur over the course of a presentation.
We observed engagement levels that were higher for Mentimeter across both types of content for almost the entire presentation. Of the 24 total slides, there were only two instances in which Mentimeter engagement was not higher than Powerpoint.
The Mentimer effect: Comparing Mentimeter events to Powerpoint slides
While overall we found that people responded positively to Mentimeter , we wanted to dig deeper and see how the specific Mentimeter events compared to the Powerpoint slides. Mentimeter events are instances in which the audience is encouraged to interact with the presentation using their mobile devices. For example, participants may have been asked about their individual opinion on a topic or they were asked to answer a quiz question related to the presentation. Figure 10 shows the average PM observed for Mentimeter events and Powerpoint slides.
Figure 10. Comparison of PM values for Mentimeter events and Powerpoint slides.
We observed that, relative to Powerpoint slides, Mentimeter events resulted in lower boredom and higher engagement, attention, interest, and cognitive load. The biggest effects were for boredom and engagement levels, which saw a 16% reduction and 13% increase, respectively.
The Mentimeter effect: How do the different Mentimeter events compare?
While Mentimeter events generally evoked positive responses in the audience, we wanted to know if some events were better than others. The Mentimeter presentations contained three types of events: Opinion events, in which the audience was asked their opinion on a topic; Quiz events, in which the audience was asked questions regarding the content of the presentation; and video events, in which participants viewed a video. Figure 11 shows PM values for each of the event types. We also included Powerpoint slides as a comparison.
Figure 11. Mean PM for each Mentimeter event type. Mean PM for Powerpoint slide included for comparison.
Opinion events showed the most consistent effect by eliciting the least amount of boredom and most amount of engagement, attention, interest, and cognitive load relative to the other events. Interestingly, video events tended to evoke the most boredom and least engagement and attention.
The Mentimeter effect: A closer look at engagement
Although all the PM trended toward positive response to Mentimeter presentations, engagement appeared to have the most consistent effect. To take a closer look, we indexed the point at which each participant demonstrated their maximum engagement PM. Figure 12 shows that a greater number of maximum engagement values occurred during the Mentimeter presentation. In addition, 70% of participants’ maximum engagement scores occurred during a Mentimeter event.
Figure 12. Distribution of maximum engagement PM.
The Mentimeter effect: Comparing objective and subjective measures
While EEG can index objective responses to stimuli, instances in which these measures bolstered by self-reports provide compelling evidence for effects. Figure 13 shows subjective engagement scores for the five engagement-related questions presented at the end of the experiment.
Figure 13. Subjective engagement scores as reported by participants on a 1-5 Likert Scale “Not at all” to “Extremely”.
Responses to all questions supported findings from the brain data. Relative to Powerpoint presentations, Mentimeter presentations resulted in participants feeling more engaged with presentations, more engaged with the presenter, more interested in the content, experienced more enjoyment of the presentation, and feeling as though they had learned more novel content during the presentation.
Summary
At the conclusion of the study, the EMOTIV research team delivered a detailed report on the findings to Mentimeter. This enabled Mentimeter to better understand their product and what made it such a positive experience for their users. Not only was Mentimeter given empirical data that demonstrated that their product elicited higher engagement, attention, cognitive load while also lowering boredom, it provided actionable insights into which of their special features were most engaging with users. The Mentimeter write up on the study findings can be found at https://www.mentimeter.com/campaigns/the-mentimeter-effect?
Studies like the Mentimeter Effect represent only a tiny fraction of the possibilities for remote, streamlined, and personalized EEG experiments. From evaluating consumer preference to investigating mental health issues, the EMOTIV research suite is the ideal platform for scalable EEG research. In collaboration with our research team, individuals, companies, and institutions can harness the power of neuroscience to gain insight into the human population. This solution represents the ideal answer to modern neuroscience that is immune to public health crises, resistant to shrinking budgets, and broadly inclusive of a global community.
Continue reading