ما هو تحليل EEG ERP؟ دليل كامل
Emotiv
تم التحديث في
10/03/2026
ما هو تحليل EEG ERP؟ دليل كامل
Emotiv
تم التحديث في
10/03/2026
ما هو تحليل EEG ERP؟ دليل كامل
Emotiv
تم التحديث في
10/03/2026
دماغك هو عاصفة دائمة من النشاط الكهربائي. حتى عندما تكون تستريح، فإن مليارات الخلايا العصبية تطلق إشارات، مما يخلق صوت خلفية من الضجيج العصبي. إذًا، كيف يمكنك عزل رد فعل الدماغ الضئيل والمحدد تجاه حدث واحد، مثل سماع صوت أو رؤية كلمة؟ إنه مثل محاولة سماع همسة واحدة في استاد مزدحم. هذا هو التحدي الدقيق الذي تم تصميم تحليل EEG ERP لحله. إنها تقنية قوية تستخدم التوسيط للإشارات لتصفية الضوضاء الخلفية، مما يكشف عن استجابة الدماغ الدقيقة المربوطة بالوقت. سيقدم لك هذا الدليل توضيحًا عن كيفية عمل هذه الطريقة، وما تعنيه مكوناتها الرئيسية، وكيف يمكنك استخدامها في بحثك الخاص.
الأفكار الرئيسية
كشف استجابات الدماغ المحددة من خلال التوسيط للإشارات: جوهر تحليل ERP هو تقنية تعزل رد فعل الدماغ الصغير والمحدد عند حدوث حدث. من خلال تقديم محفزات متعددة مرات وتوسيط بيانات EEG المقابلة، يمكنك تصفية الضوضاء العشوائية لرؤية استجابة دماغ واضحة مربوطة بالوقت.
دراسة منظمة تعطي نتائج موثوقة: يتضمن إجراء دراسة ERP ناجحة عملية واضحة من أربع مراحل. تبدأ بتصميم تجريبي قوي، يليه جمع بيانات دقيق، ومعالجة مسبقة دقيقة لإزالة الشوائب، وفي النهاية تفسير مدروس للموجات الناتجة.
فهم المقايضة بين الوقت والمكان: القوة الرئيسية لتحليل ERP تكمن في الدقة الزمنية الاستثنائية، مما يسمح لك برؤية العمليات الدماغية تحدث في ميلي ثانية. هذه الدقة الزمنية تأتي مع قيد في الدقة المكانية، مما يصعب تحديد الأصل الدقيق للنشاط داخل الدماغ.
ما هو تحليل EEG ERP؟
تحليل EEG ERP هو طريقة قوية لدراسة كيفية معالجة الدماغ للمعلومات بشكل فوري. فكر فيها كعملية ذات خطوتين. أولاً، نستخدم تخطيط الدماغ الكهربائي (EEG) لتسجيل النشاط الكهربائي العام للدماغ. ثم، نقترب من الإمكانات المتعلقة بالأحداث (ERPs)، والتي هي ردود فعل الدماغ المحددة لحدث معين، مثل رؤية صورة أو سماع صوت. من خلال الجمع بين هذين، يمكننا الحصول على رؤى دقيقة حول توقيت الوظائف الإدراكية. هذه التقنية هي ركن أساسي في علم الأعصاب الإدراكي ولها تطبيقات عملية في مجالات من التسويق العصبي إلى تطوير واجهات الدماغ الحاسوبية. دعونا نحلل كل جزء.
ما هو التخطيط الكهربائي للدماغ (EEG)؟
التخطيط الكهربائي للدماغ، أو EEG، هو وسيلة غير تدخلية لقياس النشاط الكهربائي للدماغ. دماغك دوماً في حالة نشاط كثيف حيث تتواصل مليارات الخلايا العصبية بإطلاق إشارات كهربائية صغيرة. تستخدم تقنية EEG أجهزة استشعار موضوعة على فروة الرأس لالتقاط هذا النشاط. الإشارات التي نسجلها تأتي أساسًا من مجموعات كبيرة من الخلايا العصبية التي تطلق إشارات في تزامن. إنها مثل الاستماع إلى ضوضاء مدينة مزدحمة من فوق؛ لا يمكنك سماع المحادثات الفردية، ولكنك تحصل على إحساس كبير بالنشاط العام. هذا يوفر تيار مستمر من البيانات حول حالة الدماغ، وهو الأساس لتحليل أكثر تفصيلاً.
ما هي الإمكانات المرتبطة بالأحداث (ERPs)؟
الإمكانات المرتبطة بالأحداث، أو ERPs، هي استجابة الدماغ المباشرة لحدث محدد. هي تغيرات في الجهد الكهربائي صغيرة جدًا في إشارة EEG تتزامن مع محرض، سواء كان حسياً (مثل وميض الضوء) أو معرفيًا (مثل التعرف على وجه). لأن هذه الإشارات ERP صغيرة جدًا، فهي عادةً ما تكون مخفية ضمن تسجيل EEG المستمر الأكبر. لاكتشافها، نقدم نفس المحفز عدة مرات ونوسيط استجابة الدماغ. هذه العملية تصفي "ضوضاء" الخلفية العشوائية EEG، تاركة وراءها إشارة ثابتة تمثل معالجة الدماغ لهذا الحدث المحدد.
كيف يعمل EEG وERPs معًا؟
EEG وERPs هما تدريب مثالي لدراسة الدماغ. يوفر EEG التسجيل الخام والمستمر لنشاط الدماغ، لكنه بمفرده لا يخبرنا بما يستجيب له الدماغ في أي لحظة معينة. هذا هو دور ERPs. من خلال تحليل بيانات EEG المتزامنة بدقة مع أحداث محددة، يمكننا عزل ERPs. هذا الجمع يسمح للباحثين برؤية ليس فقط أن الدماغ نشط، بل بالضبط متى يستجيب لمحفز، حتى الميلي ثانية. هذا يجعله أداة لا تقدر بثمن لفهم تسلسل العمليات المعرفية في البحث الأكاديمي.
كيف يعمل تحليل EEG ERP؟
إذًا، كيف ننتقل من الصخب الكهربائي العام للدماغ إلى استجابة محددة وذات معنى؟ عملية تحليل EEG ERP هي وسيلة ذكية لعزل إشارة صغيرة من الكثير من الضوضاء الخلفية. إنها نهج منهجي يتضمن ثلاث خطوات رئيسية: قياس النشاط الكهربائي العام للدماغ، وتقديم محفزات موقوتة بدقة لإثارة استجابة، ثم استخدام تقنية رياضية لتوسيط الضوضاء وكشف شكل الموجة ERP الأساسي.
فكر فيها مثل محاولة سماع همسة شخص واحد في غرفة مزدحمة. بمفردها، تضيع الهمسة في الضوضاء. لكن إذا تمكنت من تسجيل هذا الشخص يقول نفس الكلمة مائة مرة وتوسيط التسجيلات، فإن الدردشة الخلفية العشوائية ستتلاشى، وسيصبح صوت الهمسة الثابت واضحًا. يعمل تحليل EEG ERP على مبدأ مشابه، مما يتيح لنا رؤية كيف يستجيب الدماغ للأحداث المحددة بدقة رائعة. هذه الطريقة أساسية للعديد من أنواع البحث الأكاديمي لأنها توفر نافذة مباشرة على العمليات المعرفية كما تحدث.
قياس النشاط الكهربائي للدماغ
الخطوة الأولى هي التقاط النشاط الكهربائي الخام للدماغ باستخدام التخطيط الكهربائي للدماغ، أو EEG. أدمغتنا نشطة باستمرار، حيث تطلق وتواصل مليارات الخلايا العصبية إشارات صغيرة. هذه الأنشطة التراكمية تولد إشارات كهربائية صغيرة يمكن اكتشافها على فروة الرأس. سماعة EEG، مثل Epoc X، تستخدم مستشعرات (إلكترودات) موضوعة على الرأس لالتقاط هذه الإشارات. النتيجة هي تدفق مستمر من البيانات التي تمثل النشاط المستمر والعفوي للدماغ. هذا EEG الخام هو الأساس للتحليل، لكنه يحتوي على كل نشاط الدماغ، وليس فقط الاستجابة لحدث معين.
التقاط استجابات مربوطة بالوقت لمحفزات
بعد ذلك، نقدم "حدثًا" أو "محفزًا" لمعرفة كيف يستجيب الدماغ. يمكن أن يكون أي شيء من عرض صورة أو تشغيل صوت إلى طلب من المشارك الضغط على زر. المفتاح هنا هو التوقيت. ERPs هي استجابات دماغية مربوطة بالوقت لحدث محدد. هذا يعني أننا نحتاج إلى معرفة اللحظة الدقيقة لتقديم المحفز. يتيح لك برنامج EmotivPRO إدراج مؤشرات موقوتة في تدفق بيانات EEG، لتحديد اللحظة الدقيقة التي يحدث فيها كل حدث. هذا يخلق ارتباطًا مباشرًا بين المحفز والنشاط الدماغي الذي يتبعه، وهو أمر أساسي للخطوة النهائية.
استخدام التوسيط للإشارات لتقليل الضوضاء
استجابة الدماغ لحدث واحد (ERP) صغيرة بشكل كبير وعادةً ما تكون مدفونة ضمن إشارة EEG الخلفية الأكبر بكثير. لاكتشافها، نستخدم تقنية تسمى التوسيط للإشارات. يتم تصميم التجربة بحيث يتعرض المشارك لنفس النوع من المحفز مرات عديدة. بعد ذلك، نأخذ الجزء الصغير من بيانات EEG مباشرة بعد كل محفز ونوسيط كل هذه الأجزاء معًا. نظرًا لأن النشاط الخلفي للدماغ عشوائي، فإنه يتوسط ويُلغي ذاته. ومع ذلك، فإن استجابة الدماغ للمحفز متسقة وتحدث في نفس الوقت بعد كل حدث. تبقى هذه الإشارة المتوسطة بعد التوسيط، مما يكشف عن شكل الموجة ERP النظيف.
ماذا تعني المكونات الرئيسية لـ ERP؟
بمجرد حصولك على شكل الموجة ERP المتوسط، الخطوة التالية هي التعرف على ميزاته الرئيسية، المعروفة بالمكونات. هذه المكونات هي قمم ووديان محددة في شكل الموجة التي تتوافق مع مراحل مختلفة من المعالجة الحسية والمعرفية. تُسمى عادة بحرف يحدد قطبيتها (P للإيجابية، N للسلبية) ورقم يشير إلى مدة تأخرها التقريبي، أو توقيتها، بالميلي ثانية بعد المحفز. على سبيل المثال، P300 هي ذروة متجهة نحو الإيجابية تحدث حوالي 300 ميلي ثانية بعد المحفز. دعونا نلقي نظرة على بعض المكونات الأكثر دراسة.
المكونات الحسية المبكرة (N100, P100)
تعكس مكونات ERP المبكرة المراحل الأولية واللاإرادية من المعالجة الحسية. على سبيل المثال، N100 هي ذروة سلبية تظهر حوالي 100 ميلي ثانية بعد محفز. تُعرف غالبًا بأنها "استجابة توجيهية" للدماغ لأنها تعكس الاكتشاف التلقائي لمحفز جديد أو غير متوقع مثل سماع صوت غير متوقع أو رؤية شيء غريب. يمكنك اعتباره رد فعل الدماغ الأولي "ما كان ذلك؟" قبل أن تقوم حتى بمعالجة الحدث بوعي. وبالمثل، P100 هي مكون إيجابي مبكر، غالبًا ما تتم دراسته في استجابة للمحفزات البصرية، الذي يعكس المعالجة الأولية في القشرة البصرية. توفر هذه الإشارات المبكرة نافذة على اللحظات الأولى لكيفية تسجيل أدمغتنا للعالم من حولنا.
المكونات المعرفية (P300, N400, P600)
ترتبط المكونات اللاحقة بوظائف معرفية أكثر تعقيدًا مثل الانتباه والذاكرة واللغة. P300 هي واحدة من أكثر الإمكانات المتعلقة بالأحداث شهرة، وتظهر عندما يتعرف شخص ما على محفز ذو معنى أو مرتبط بالمهمة. يمكن أن يشير اتساعها إلى مدى الانتباه الموجه، في حين يمكن أن يعكس تأخيرها سرعة معالجة المعلومات. يرتبط المكون N400 بقوة باللغة والمعنى. يظهر عندما يكتشف الدماغ عدم تطابق دلالي، مثل سماع الجملة: "أنا أتناول قهوتي مع الكريمة والجوارب." أخيرًا، يرتبط المكون P600 بالمعالجة التصريفية، ويظهر عندما يكتشف الدماغ أخطاء نحوية أو تراكيب جمل معقدة.
السلبية المتعلقة بالأخطاء والانتباه
بعض مكونات ERP لا ترتبط بمحفز خارجي ولكن بحدث داخلي، مثل ارتكاب خطأ. السلبية المتعلقة بالأخطاء (ERN) هي تذبذب سلبي حاد يحدث خلال 100 ميلي ثانية من القيام برد فعل خاطئ في مهمة ما. إنها كإشارة "آه، أفسدت!" داخلية، تعكس نظام الدماغ السريع لاكتشاف الأخطاء، غالبًا قبل أن تكون واعيًا بالخطأ. يمكن لمكونات ERP الأخرى أن تكشف عن كيفية تخصيصنا للانتباه. من خلال مقارنة استجابة الدماغ للمحفزات المهتمة مقابل المهملة، يمكن للباحثين رؤية كيفية معالجة الدماغ للمعلومات بشكل انتقائي وتصفيتها من الضوضاء، مما يوفر رؤى حول آليات السيطرة على الانتباه.
ما هو المعدات اللازمة لإجراء دراسة ERP؟
لبدء دراسة ERP، يجب اختيار الأدوات المناسبة للعمل. يتكون إعدادك من جزئين رئيسيين: المعدات الصلبة التي تلتقط إشارات الدماغ والبرامج التي تساعدك في فهمها. فكر فيه كبناء استوديو تسجيل عالي التقنية للدماغ. تحتاج إلى ميكروفون جيد (سماعة EEG) لالتقاط الصوت ولوحة مزج (البرمجيات) لتنظيفها وتحليلها. دعنا نستعرض القرارات الأساسية المتعلقة بالمعدات التي ستحتاج إلى اتخاذها.
اختيار سماعة EEG وإعداد الإلكترودات
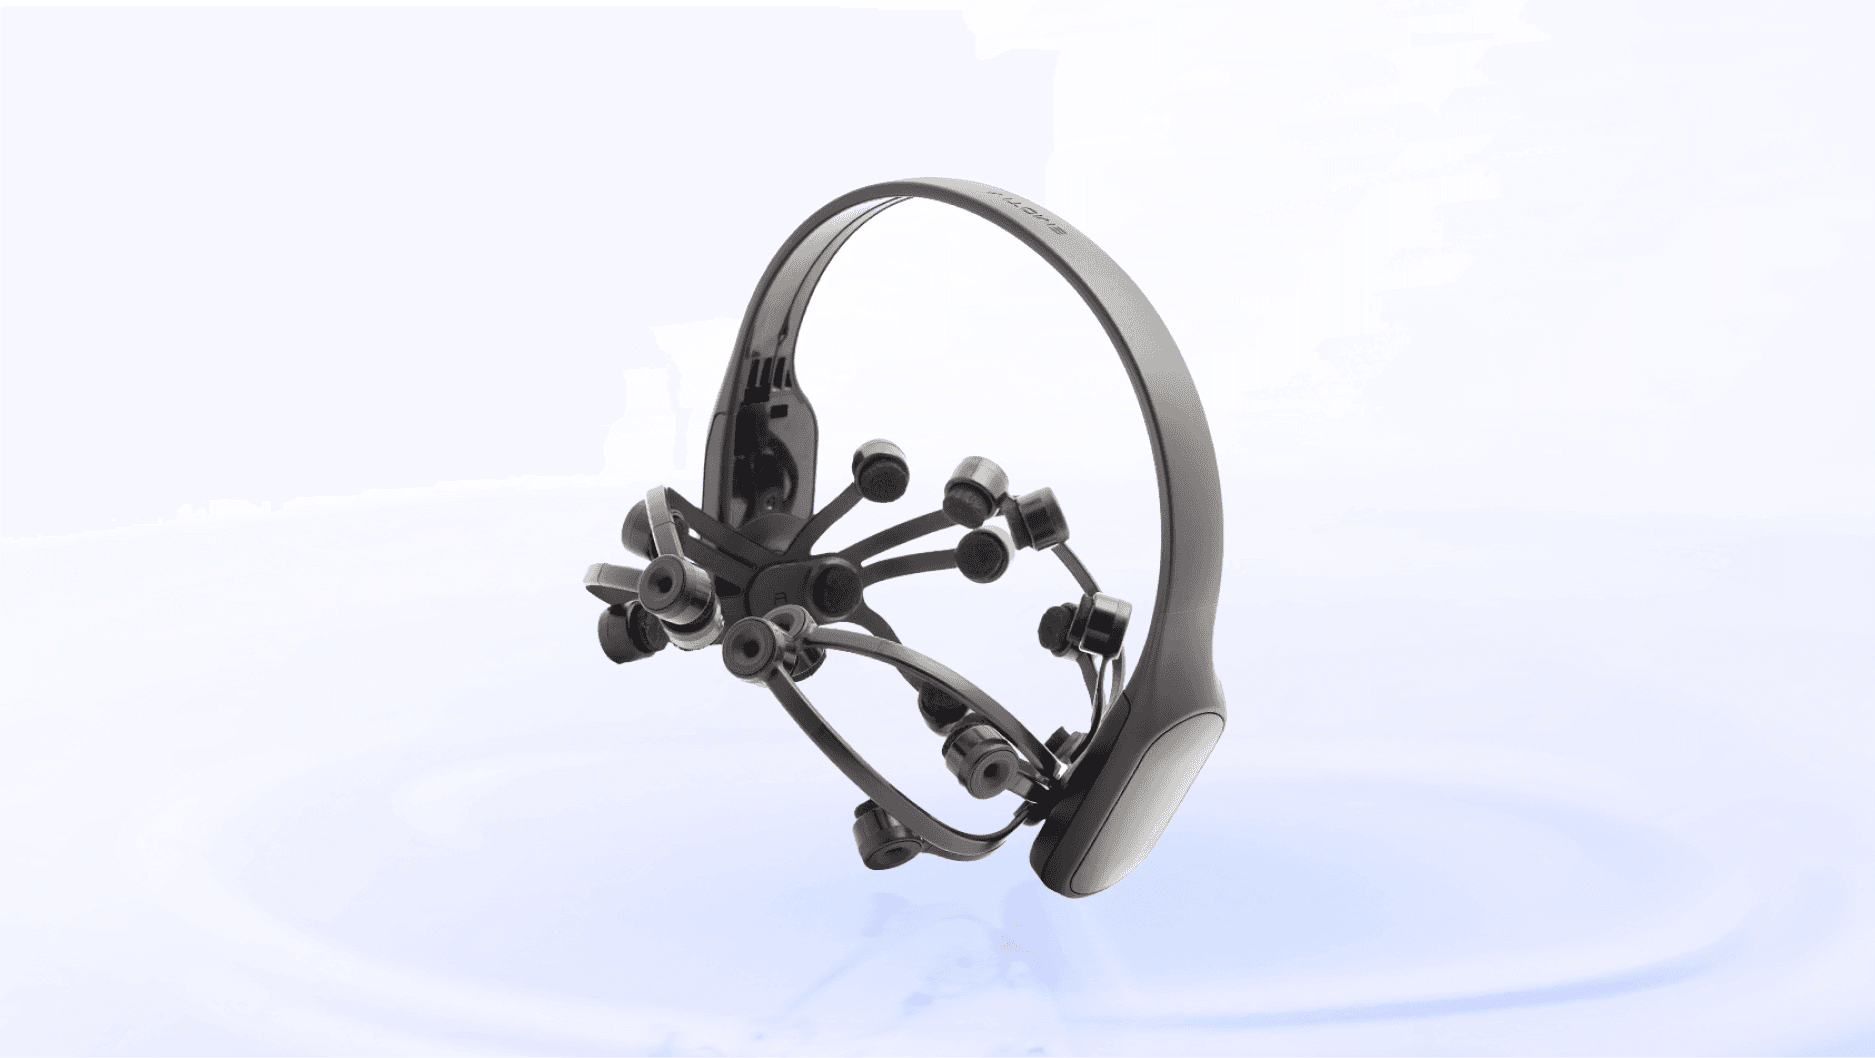
نظام EEG هو أكثر من مجرد سماعة. فهو شامل للإلكترودات لالتقاط الإشارات الكهربائية للدماغ، ومكبرات لتقويتها، ومحولات لتحويلها إلى بيانات رقمية يمكن لجهازك قراءتها. العامل الحاسم هو عدد الإلكترودات، أو القنوات. بينما يمكن لبعض الدراسات العمل بعدد أقل من القنوات، فإن معظم البحث الأكاديمي يستفيد من كثافة أعلى من الإلكترودات (غالبًا 32 أو أكثر) للحصول على خريطة أكثر تفصيلاً لنشاط الدماغ.
تعتمد السماعة المناسبة بالكامل على سؤال بحثك. سماعتنا Insight ذات الخمس قنوات هي رائعة للأنماط البسيطة، بينما يوفر Epoc X ذو الأربع عشرة قناة تفاصيل مكانية أكثر. للحصول على تسجيلات عالية الكثافة تمنحك رؤية شاملة، فإن نظام Flex ذو القنوات الاثنين والثلاثين هو خيار رائع.
اختيار البرمجيات لجمع البيانات ومعالجتها
بمجرد حصولك على المعدات الصلبة، تحتاج إلى برنامج قوي لتسجيل، عرض، ومعالجة بيانات EEG. هذا هو المكان الذي يتم فيه تنظيف الإشارات الخام وتجهيزها لتحليل ERP. يجب أن يسمح لك البرنامج بتصفية الضوضاء، وإزالة الشوائب (مثل الوميض أو حركات العضلات)، وتجزئة البيانات حول أحداثك التجريبية.
صممنا EmotivPRO للتعامل مع هذه المهام بالضبط، مما يمنحك حلاً كاملًا لاكتساب البيانات وتحليلها مباشرةً من العلبة. لأولئك الذين يفضلون بناء خطوط تحليلهم الخاصة، فإن أنظمتنا متوافقة أيضًا مع بيئات البرمجة الشائعة مثل بايثون و MATLAB. يمكنك العثور على الأدوات التي تحتاجها لدمج معداتنا مع برمجياتك الخاصة على منصة المطورين الخاصة بنا.
الاختيار بين أنظمة الجل والملح
للحصول على إشارة نظيفة، تحتاج إلى وصل جيد بين إلكترودات EEG وفروة الرأس. يتم تحقيق ذلك عادةً باستخدام وسط موصل، في الأغلب محلول ملحي أو جل. توفر الأنظمة التقليدية المعتمدة على الجل وصلة مستقرة وجودة عالية، وهو مثالي للجلسات الطويلة. ومع ذلك، قد تكون فوضوية في الإعداد والتنظيف.
تقدم الأنظمة التي تعتمد على المياه المالحة بديلاً أكثر ملاءمة. فهي أسرع في الإعداد وأسهل كثيرًا في التنظيف، مما يجعل التجربة أكثر راحة للمشاركين. نحن نقدم كلا الخيارين مع سماعات Flex Saline و Flex Gel. غالبًا ما يعود الاختيار إلى موازنة متطلبات تجربتك مع الجوانب العملية للإعداد وراحة المشاركين.
كيفية إجراء دراسة تحليل EEG ERP
قد يبدو إجراء أول دراسة EEG ERP كبيرة، لكنها أكثر قابلية للإدارة عند تقسيمها إلى خطوات واضحة وقابلة للتنفيذ. تعتمد دراسة ناجحة على نهج منهجي، بدءًا من شرارة السؤال البحثي الأولية إلى التفسير النهائي لبياناتك. فكر في الأمر كبناء شيء: تحتاج إلى مخطط ثابت قبل أن تبدأ في وضع الأساس. التسرع في جمع البيانات دون خطة واضحة يمكن أن يؤدي إلى نتائج مربكة أو، أسوأ من ذلك، إلى بيانات لا تجيب في الواقع على سؤالك.
في هذا الدليل، سنستعرض المراحل الأربع الأساسية لإجراء دراسة تحليل ERP. أولاً، سنغطي كيفية تصميم تجربة قوية بفرضية واضحة. بعد ذلك، سنلقي نظرة على جوانب تحضير المشاركين وجمع بيانات EEG عالية الجودة. بعد ذلك، سنتعمق في خطوة بالغة الأهمية وهي معالجة بياناتك لتصفية الضوضاء والشوائب. أخيرًا، سنستكشف كيفية تحليل أشكال الموجة ERP واستنتاج استنتاجات ذات معنى. اتباع هذه الخطوات سيضمن أن تكون نتائجك موثوقة وغنية بالرؤية. وجود الأدوات المناسبة لواجهة الدماغ الحاسوبية يساعد في جعل هذه العملية أكثر سلاسة، مما يسمح لك بالتركيز أكثر على بحثك وأقل على العوائق التقنية.
تصميم تجربتك والنموذج
تصميم تجربتك هو أساسها. قبل أن تفكر حتى في وضع سماعة على أحدهم، تحتاج إلى فرضية واضحة. ما هو السؤال المحدد الذي تحاول الإجابة عليه؟ صمم دراستك لاختبار سلوك مكونات ERP معينة في استجابة لمحفزاتك مباشرةً. على سبيل المثال، إذا كنت تريد دراسة الانتباه، فيجب أن تكون المحفزات في الظروف 'الملاحظة' و'غير الملاحظة' متطابقة ماديًا. هذا التحكم يضمن أن أي اختلافات تراها في استجابة الدماغ ناتجة عن العملية الإدراكية للانتباه، وليس عن تباين في المحفز نفسه. الاستكشاف بدون فرضية يمكن أن يقودك إلى 'إعادة اكتشاف' آثار معروفة أو إلى بيانات فوضوية وغامضة.
تحضير المشاركين وجمع البيانات
بمجرد تحديد التصميم، حان وقت جمع البيانات باستخدام سماعة مثل Epoc X. مبدأ رئيسي في بحث ERP هو أنك تحتاج إلى العديد من المحاولات للحصول على إشارة نظيفة. استجابة الدماغ لحدث واحد صغيرة ومدفونة في نشاط كهربائي آخر. من خلال توسيط الاستجابات عبر العشرات أو حتى المئات من المحاولات، تلغي الضوضاء العشوائية، وتظهر الإمكانية المتعلقة بالحدث. من المهم أيضًا التحقق من نشاط الدماغ في 'فترة الأساس' قبل ظهور المحفز. إذا رأيت اختلافات كبيرة بين الظروف أثناء هذا الأساس، فهي إشارة تحذيرية أن بياناتك قد تكون لديها مشاكل تحتاج إلى معالجة قبل المتابعة مع تحليلك.
معالجة بياناتك وإزالة الشوائب
بيضانات EEG الخام نادرًا ما تكون مثالية. تحتوي على 'شائبات'، التي هي إشارات كهربائية ليست من الدماغ، مثل الوميض، وحركات العينين، أو توتر العضلات. هذه الإشارات يمكن أن تكون أكبر بكثير من الإمكانات المتعلقة بالأحداث التي تبحث عنها، لذا يلزم إزالتها. أفضل طريقة للتعامل مع ذلك هي تحديد وإزالة المحاولات التي تحدث فيها هذه الشوائب. ستستخدم أيضًا تقنيات مثل 'تصحيح الأساس'، حيث تطرح الجهد المتوسط من فترة ما قبل المحفز من كامل المحاولة. هذا يساعد على إزالة الانحرافات البطيئة في الإشارة. صمم برنامج EmotivPRO لمساعدتك في تنفيذ هذه الخطوات الأساسية للمعالجة المسبقة، وتنظيف بياناتك بحيث يمكنك الوثوق في نتائجك.
تحليل أشكال الموجة وتفسير النتائج
بعد المعالجة المسبقة، ستكون لديك أشكال موجة ERP نظيفة، التي تظهر قمماً وودياناً متميزة تسمى 'مكونات.' كل مكون، مثل P300 أو N400، يُعرف بتوقيته وقطبيته (إيجابي أو سلبي)، وموقعه على فروة الرأس. عند تحليل هذه المكونات، يكون من المغري فقط قياس النقطة الأكثر ارتفاعاً أو انخفاضاً لقمة، لكن هذا يمكن أن يكون مضللًا بسبب الضوضاء. طريقة أكثر قوة هي حساب متوسط السعة عبر نافذة زمنية محددة حيث يتوقع ظهور المكون. تفسير هذه المكونات في سياق تصميمك التجريبي هو المكان الذي يمكنك أخيرًا من الإجابة عن سؤالك البحثي والمساهمة في مجال البحث والتعليم الأكاديمي.
ما هي التطبيقات الرئيسية لتحليل EEG ERP؟
نظرًا لأن تحليل EEG ERP يمنحنا نظرة دقيقة على الجدول الزمني لمعالجات الدماغ، فقد أصبح أداة ذات قيمة في العديد من المجالات المختلفة. من المختبرات الأكاديمية إلى وكالات التسويق، يستخدم الباحثون ERPs للكشف عن رؤى كان من الممكن أن تظل مخفية. دعونا ننظر في بعض التطبيقات الأكثر شيوعًا ونرى كيف يتم استخدام هذه التقنية لدفع حدود ما نعرفه عن الدماغ البشري.
البحث الأكاديمي وعلم الأعصاب الإدراكي
في علوم الأعصاب الأكاديمية والإدراكية، تعتبر إمكانات ERPs أساسًا لدراسة كيفية عمل الدماغ الداخلي. فهي تساعد العلماء في فهم كيفية معالجة الدماغ للمعلومات، بدءًا من التصورات الحسية الأساسية إلى المهام الإدراكية المعقدة مثل اتخاذ القرار وفهم اللغة. نظرًا لأن الإمكانات المتعلقة بالأحداث تقدم رؤية لحظة بلحظة للنشاط العصبي، يمكن للباحثين تحديد التوقيت الدقيق للعمليات العقلية المختلفة. تتيح هذه الدقة لهم اختبار فرضيات محددة حول الانتباه، والذاكرة، والتعلم. على سبيل المثال، قد تكشف دراسة ERP عن مدى سرعة قدرة الدماغ على التفريق بين الأصوات المهمة وغير المهمة في بيئة صاخبة. صممنا حلولنا الصلبة والبرمجية لدعم هذا النوع من البحث والتعليم الأكاديمي المفصل، مما يجعل علوم الأعصاب المتقدمة أكثر سهولة.
التقييم السريري
تعمل إمكانات ERPs أيضًا كأداة مهمة في المجالات السريرية لتقييم وظيفة الجهاز العصبي. تقوم هذه الاختبارات بقياس الوقت الذي يستغرقه الدماغ للاستجابة للمحفزات الحسية المختلفة، مثل الأصوات أو الصور. من خلال تحليل توقيت وقوة هذه الاستجابات، يمكن للأطباء جمع بيانات موضوعية حول معالجة الشخص العصبية. يمكن لهذه المعلومات أن تساعد في الكشف عن عدم انتظام في كيفية عمل الجهاز العصبي وتقديم صورة أوضح عن التجربة اليومية للشخص. بينما لا يعد تحليل ERPs أداة تشخيصية بمفرده، إلا أنه يمكن أن يقدم رؤى قيمة تكمل التقييمات السريرية الأخرى، مما يساهم في فهم أكثر شمولاً للحالة الذهنية للشخص.
تطوير واجهة الدماغ الحاسوبية (BCI)
تجعل دقة إمكانات ERPs منها حجر الزاوية في تطوير واجهة الدماغ الحاسوبية الحديثة. تخلق أنظمة BCI مسار اتصال مباشر بين الدماغ وجهاز خارجي، مثل الكمبيوتر أو الطرف الاصطناعي. يمكن ترجمة النشاط الكهربائي للدماغ الناتج عن إطلاق الخلايا العصبية إلى أوامر. على سبيل المثال، يتم استخدام المكون P300، الذي يظهر عندما يتعرف المرء على محفز نادر أو مهم، غالبًا في تطبيقات "كُتاب P300". من خلال التركيز على حرف معين على الشاشة، يمكن للمستخدم توليد استجابة P300 يترجمها واجهة الدماغ الحاسوبية لكتابة ذلك الحرف. هذا التطبيق يوضح كيف يمكن تسخير إمكانات ERPs لإنشاء تقنيات مساعدة قوية.
التسويق العصبي وتحليل المستهلكين
في عالم التسويق العصبي، توفر إمكانات ERPs نافذة إلى العقل اللاواعي للمستهلك. تعتمد الطرق التقليدية مثل الاستطلاعات على ما يقوله الناس أنهم يشعرون به، لكن إمكانات ERPs يمكنها التقاط ردودهم الحقيقية وغير المفلترة على الإعلانات والمنتجات والشعارات التجارية. من خلال تحليل كيفية معالجة الدماغ للمعلومات البصرية والسمعية من المواد التسويقية، يمكن للشركات الحصول على رؤى موثوقة حول ما يجذب الانتباه حقًا ويثير الاستجابة العاطفية. هذا ذو قيمة كبيرة لفهم سلوك المستهلك واتخاذ قرارات مبنية على البيانات حول الحملات الإبداعية وتصميم المنتجات. يمكن أن تساعد إمكانات ERPs في الإجابة عن أسئلة مثل: "هل استحوذ هذا الشعار على انتباههم؟" أو "هل كانت الرسالة الرئيسية في إعلاننا لها صدى؟"
ما هي إيجابيات وسلبيات تحليل EEG ERP؟
مثل أي طريقة علمية، يمتلك تحليل EEG ERP نقاط قوة وضعف. فهم هذه النقاط الأساسية في تصميم دراسة قوية وتفسير النتائج بدقة. من ناحية، يقدم تحليل EEG ERP دقة مذهلة في التوقيت، مما يسمح لك برؤية العمليات الدماغية تتكشف في الوقت الحقيقي. من ناحية أخرى، لديه بعض القيود التي يجب مراعاتها. دعونا نستعرض أبرز الإيجابيات والسلبيات حتى تشعر بالثقة في نهجك لاستخدام هذه التقنية القوية.
إيجابية: توقيت ممتاز وفعالية من حيث التكلفة
أكبر ميزة لـ ERPs هي دقتها الزمنية الرائعة. نظرًا لأنك تقيس مباشرة النشاط الكهربائي للدماغ، يمكنك رؤية التغييرات تحدث من ميلي ثانية إلى أخرى. تجعل هذه الدقة الزمنية EmotivPRO مثالية لدراسة العمليات الإدراكية السريعة مثل الإدراك وفهم اللغة والانتباه. لا يوجد أي طريقة تصوير دماغ غير تدخلية أخرى تقترب من هذا المستوى من دقة التوقيت. مقارنة بتقنيات التصوير العصبي الأخرى مثل fMRI أو MEG، فإن إعداد دراسة بحث أكاديمي باستخدام EEG يكون أكثر اقتصاديا بكثير، مما يجعله متاحًا لمجموعة واسعة من المشاريع والمختبرات.
سلبية: قيود مكانية ومشكلة الانعكاس
بينما تخبرك إمكانات ERPs متى يحدث الحدث العصبي بدقة كبيرة، يكون من الصعب معرفة أين تحديدًا في الدماغ ينشأ. تتشوه الإشارات الكهربائية التي تنشأ داخل الدماغ وتنشر أثناء مرورها عبر أنسجة الدماغ والجمجمة وفروة الرأس. محاولة تحديد الأصل الدقيق لإشارة سجلت على فروة الرأس هو تحدٍ معروف باسم "مشكلة الانعكاس." بينما يمكن أن توفر سماعة ذات قنوات أكثر، مثل Flex Saline، معلومات مكانية أفضل، إلا أن إمكانات ERPs ليست الأداة المثالية إذا كان سؤالك البحثي الأساسي يتعلق بتحديد وظيفة الدماغ.
سلبية: شوائب الإشارة والتأكد من الجودة
تكون إشارتك EEG حساسة، وليس فقط للنشاط الدماغي. الأشياء البسيطة مثل الرمش أو تحريك العينين أو شد الفك يمكنها أن تخلق إشارات كهربائية كبيرة تدعى شوائب يمكنها بسهولة تلوث بياناتك. غالبًا ما تكون هذه الشوائب أكبر بكثير من إمكانات ERPs الصغيرة التي تحاول قياسها، لذا يمكن أن تخفي أو تشوه نتائجك. أفضل طريقة للتعامل مع ذلك هي إزالة المحاولات التي تحتوي على هذه الشوائب بعناية أثناء معالجة البيانات المسبقة. يتضمن برنامج EmotivPRO أدوات لمساعدتك في تحديد وإدارة هذه الشوائب، مما يضمن أنك تبقى مع بيانات عالية الجودة لتحليلك.
سلبية: الفروق الفردية في النشاط الدماغي
لا يوجد دماغان متطابقان تمامًا، وتظهر هذه الاختلافات في بيانات ERP. لدى الناس اختلافات فردية في شكل الدماغ، وسمك الجمجمة، وحتى طرق مختلفة لمعالجة المعلومات، وكل ذلك يمكن أن يؤثر على مكونات ERP. هذا يعني أنك سترى تنوعًا طبيعيًا من مشارك إلى آخر، حتى في الاستجابة لمحفز بسيط. من المهم أن تكون واعيًا بهذا التباين عند تصميم دراستك. إن ضمان وجود عدد كافٍ من المشاركين واستخدام الطرق الإحصائية المناسبة أمر حاسم لضمان أن نتائجك تعكس تأثيرات إدراكية حقيقية وليس مجرد تفردات فردية.
مفاهيم خاطئة شائعة حول تح解析 EEG ERP
يعتبر تحليل الإمكانات المرتبطة بالأحداث أداة مفيدة جدًا، لكن مثل أي طريقة علمية، تحتوي على تفاصيل دقيقة. يمكن أن تظهر بعض الفهم الخاطئ الشائعة، خاصة لأولئك الجدد في هذا المجال. التغلب على هذه التشويشات المحتملة أساسي لتصميم تجارب قوية واستنتاج استنتاجات دقيقة من بياناتك. دعونا نتناول بعض الفهمات الخاطئة الأكثر شيوعًا حتى تتمكن من الاقتراب من دراسات ERP بثقة.
خلط المثيرات الفيزيائية بالتأثيرات الإدراكية
من السهل الوقوع في فخ خلط الاختلافات الفيزيائية في المحفزات مع التأثيرات الإدراكية التي تريد قياسها. على سبيل المثال، إذا كنت تدرس الانتباه، تحتاج إلى التأكد من أن المحفزات التي تقدمها في ظروف 'الملاحظة' و'عدم الملاحظة' متطابقة فيزيائيًا. إذا كان واحد من المحفزات أكثر سطوعًا أو أعلى صوتًا أو أكبر من الآخر، فإن الاختلافات التي تراها في شكل موجة ERP قد تكون مجرد الدماغ يتفاعل مع تلك الخصائص الفيزيائية، وليس تأثيرات الانتباه. تصميم التجربة القوي يضمن أن الشيء الوحيد الذي يتغير بين الظروف هو المهمة الإدراكية التي تحقق فيها.
تجاهل توقيت المحفز وERP الناتج
يهم توقيت تجربتك بشكل كبير. إذا قدمت المحفزات بسرعة كبيرة معًا، يمكنك مواجهة مشكلة تسمى ERP الناتج. فكر فيها كفترة برودة قصيرة لاستجابة الدماغ. عندما تظهر المحفزات بتتابع سريع، يمكن أن تكون استجابة الدماغ للمحفز الثاني أو الثالث أصغر بكثير، خاصة للمكونات الحسية المبكرة مثل N1 وP2. يمكن أن تستمر هذه الفترة الحرجة لأكثر من ثانية. إذا كان توقيتك سريعًا جدًا، فإن إمكانات ERPs الناتجة قد لا تعكس بدقة العملية الإدراكية التي تدرسها. إنها قيد فيزيولوجي وليس إدراكي، لذا من الضروري ضبط فترات المحفز بشكل مناسب.
تبسيط ما تعنيه مكونات ERP
من المغري إعطاء معنى واحد بسيط لمكون ERP معين، مثل القول بأن "P300 دائمًا يعني المفاجأة." رغم أن ذلك يمكن أن يكون نقطة انطلاق مفيدة، إلا أنه تبسيط مخل. كل مكون يتم تعريفه بعدة خصائص: قطبيته (إيجابية أو سلبية)، توقيته بعد المحفز، وأين يظهر على فروة الرأس. يمكن أن يتغير معنى هذه المكونات ERP بناءً على المهمة المحددة. يتطلب تفسير دقيق النظر في السياق الكامل للتجربة بدلاً من مجرد تطبيق تسمية بسيطة. هذا يساعدك في فهم القصة الغنية التي ترويها بياناتك حول المعالجة الإدراكية.
مقالات ذات صلة
أسئلة شائعة
ما هي أبسط طريقة لفهم الفرق بين EEG و ERP؟ فكر في EEG وكأنك تستمع إلى جميع المحادثات التي تجري في متجر قهوة مزدحم دفعة واحدة. إنه النشاط الكهربائي الشامل والمستمر للدماغ. بينما ERP، من ناحية أخرى، مثل عزل اللحظة التي يستجيب فيها الجميع في المتجر لحدث معين، مثل تحطم صاخب. نقوم بتوسيط تلك الاستجابة المحددة على العديد من المثيلات لتصفية الضوضاء الخلفية، مما يتركنا بإشارة واضحة لكيفية معالجة الدماغ لهذا الحدث الفردي.
كم مرة أحتاج إلى عرض محفز للحصول على إشارة ERP واضحة؟ لا يوجد رقم سحري واحد، حيث يعتمد الأمر على مدى قوة استجابة الدماغ للمحفز الخاص بك. للحصول على استجابات حسية مبكرة وواضحة جدًا، قد تحصل على إشارة جيدة مع ما لا يقل عن 40 أو 50 محاولة لكل حالة. للحصول على مكونات معرفية أكثر دقة وتعقيدًا، من المحتمل أن تحتاج إلى التخطيط لمائة محاولة أو أكثر لتوسيط الضوضاء بفعالية ورؤية شكل الموجة الأساسي.
هل يمكنني استخدام تحليل ERP لمعرفة ما يفكر فيه أو يشعر به شخص ما؟ لا، تحليل ERP لن يسمح لنا برؤية محتوى أفكار شخص ما. يظهر لنا توقيت وتسلسل كيفية معالجة الدماغ للمعلومات. على سبيل المثال، يمكننا أن نرى أن الدماغ سجل كلمة غير متوقعة في جملة، لكن لا يمكننا معرفة الكلمة التي كان يتوقعها الشخص بدلاً من ذلك. إنها أداة لفهم آليات الإدراك، وليس لتفسير الأفكار أو المشاعر المحددة.
أي سماعة من Emotiv يجب أن أختارها لدراسة ERP؟ تعتمد أفضل سماعة حقًا على تعقيد سؤال بحثك. سماعة Insight ذات الخمس قنوات هي نقطة انطلاق رائعة للتجارب البسيطة جدًا مع مكونات ERP واضحة جدًا. للدراسات الأكثر تفصيلاً حيث يكون موقع استجابة الدماغ مهمًا، توفر سماعة Epoc X ذات الأربع عشرة قناة معلومات أكثر دقة. إذا كان عملك يتطلب خريطة شاملة وعالية الكثافة للنشاط الدماغي، فإن نظام Flex ذو القنوات الاثنين والثلاثين هو الخيار المثالي.
ما هو الخطأ الأكثر شيوعًا الذي يرتكبه المبتدؤون عند بدء دراسة ERP؟ الفخ الأكثر شيوعًا هو عدم وجود تصميم تجريبي مضبوط تمامًا. من السهل الفصل عن التصميمات الفيزيائية لمحفزاتك، على سبيل المثال، جعل صورة واحدة أكثر سطوعًا قليلاً من الأخرى. عندما يحدث ذلك، لا يمكنك التأكد مما إذا كانت الاختلافات في بيانات ERP ناتجة عن العملية الإدراكية التي تدرسها أو فقط برد فعل الدماغ على ذلك التغيير الفيزيائي. التصميم القوي والمضبوط هو الجزء الأكثر أهمية من أي دراسة ناجحة.
دماغك هو عاصفة دائمة من النشاط الكهربائي. حتى عندما تكون تستريح، فإن مليارات الخلايا العصبية تطلق إشارات، مما يخلق صوت خلفية من الضجيج العصبي. إذًا، كيف يمكنك عزل رد فعل الدماغ الضئيل والمحدد تجاه حدث واحد، مثل سماع صوت أو رؤية كلمة؟ إنه مثل محاولة سماع همسة واحدة في استاد مزدحم. هذا هو التحدي الدقيق الذي تم تصميم تحليل EEG ERP لحله. إنها تقنية قوية تستخدم التوسيط للإشارات لتصفية الضوضاء الخلفية، مما يكشف عن استجابة الدماغ الدقيقة المربوطة بالوقت. سيقدم لك هذا الدليل توضيحًا عن كيفية عمل هذه الطريقة، وما تعنيه مكوناتها الرئيسية، وكيف يمكنك استخدامها في بحثك الخاص.
الأفكار الرئيسية
كشف استجابات الدماغ المحددة من خلال التوسيط للإشارات: جوهر تحليل ERP هو تقنية تعزل رد فعل الدماغ الصغير والمحدد عند حدوث حدث. من خلال تقديم محفزات متعددة مرات وتوسيط بيانات EEG المقابلة، يمكنك تصفية الضوضاء العشوائية لرؤية استجابة دماغ واضحة مربوطة بالوقت.
دراسة منظمة تعطي نتائج موثوقة: يتضمن إجراء دراسة ERP ناجحة عملية واضحة من أربع مراحل. تبدأ بتصميم تجريبي قوي، يليه جمع بيانات دقيق، ومعالجة مسبقة دقيقة لإزالة الشوائب، وفي النهاية تفسير مدروس للموجات الناتجة.
فهم المقايضة بين الوقت والمكان: القوة الرئيسية لتحليل ERP تكمن في الدقة الزمنية الاستثنائية، مما يسمح لك برؤية العمليات الدماغية تحدث في ميلي ثانية. هذه الدقة الزمنية تأتي مع قيد في الدقة المكانية، مما يصعب تحديد الأصل الدقيق للنشاط داخل الدماغ.
ما هو تحليل EEG ERP؟
تحليل EEG ERP هو طريقة قوية لدراسة كيفية معالجة الدماغ للمعلومات بشكل فوري. فكر فيها كعملية ذات خطوتين. أولاً، نستخدم تخطيط الدماغ الكهربائي (EEG) لتسجيل النشاط الكهربائي العام للدماغ. ثم، نقترب من الإمكانات المتعلقة بالأحداث (ERPs)، والتي هي ردود فعل الدماغ المحددة لحدث معين، مثل رؤية صورة أو سماع صوت. من خلال الجمع بين هذين، يمكننا الحصول على رؤى دقيقة حول توقيت الوظائف الإدراكية. هذه التقنية هي ركن أساسي في علم الأعصاب الإدراكي ولها تطبيقات عملية في مجالات من التسويق العصبي إلى تطوير واجهات الدماغ الحاسوبية. دعونا نحلل كل جزء.
ما هو التخطيط الكهربائي للدماغ (EEG)؟
التخطيط الكهربائي للدماغ، أو EEG، هو وسيلة غير تدخلية لقياس النشاط الكهربائي للدماغ. دماغك دوماً في حالة نشاط كثيف حيث تتواصل مليارات الخلايا العصبية بإطلاق إشارات كهربائية صغيرة. تستخدم تقنية EEG أجهزة استشعار موضوعة على فروة الرأس لالتقاط هذا النشاط. الإشارات التي نسجلها تأتي أساسًا من مجموعات كبيرة من الخلايا العصبية التي تطلق إشارات في تزامن. إنها مثل الاستماع إلى ضوضاء مدينة مزدحمة من فوق؛ لا يمكنك سماع المحادثات الفردية، ولكنك تحصل على إحساس كبير بالنشاط العام. هذا يوفر تيار مستمر من البيانات حول حالة الدماغ، وهو الأساس لتحليل أكثر تفصيلاً.
ما هي الإمكانات المرتبطة بالأحداث (ERPs)؟
الإمكانات المرتبطة بالأحداث، أو ERPs، هي استجابة الدماغ المباشرة لحدث محدد. هي تغيرات في الجهد الكهربائي صغيرة جدًا في إشارة EEG تتزامن مع محرض، سواء كان حسياً (مثل وميض الضوء) أو معرفيًا (مثل التعرف على وجه). لأن هذه الإشارات ERP صغيرة جدًا، فهي عادةً ما تكون مخفية ضمن تسجيل EEG المستمر الأكبر. لاكتشافها، نقدم نفس المحفز عدة مرات ونوسيط استجابة الدماغ. هذه العملية تصفي "ضوضاء" الخلفية العشوائية EEG، تاركة وراءها إشارة ثابتة تمثل معالجة الدماغ لهذا الحدث المحدد.
كيف يعمل EEG وERPs معًا؟
EEG وERPs هما تدريب مثالي لدراسة الدماغ. يوفر EEG التسجيل الخام والمستمر لنشاط الدماغ، لكنه بمفرده لا يخبرنا بما يستجيب له الدماغ في أي لحظة معينة. هذا هو دور ERPs. من خلال تحليل بيانات EEG المتزامنة بدقة مع أحداث محددة، يمكننا عزل ERPs. هذا الجمع يسمح للباحثين برؤية ليس فقط أن الدماغ نشط، بل بالضبط متى يستجيب لمحفز، حتى الميلي ثانية. هذا يجعله أداة لا تقدر بثمن لفهم تسلسل العمليات المعرفية في البحث الأكاديمي.
كيف يعمل تحليل EEG ERP؟
إذًا، كيف ننتقل من الصخب الكهربائي العام للدماغ إلى استجابة محددة وذات معنى؟ عملية تحليل EEG ERP هي وسيلة ذكية لعزل إشارة صغيرة من الكثير من الضوضاء الخلفية. إنها نهج منهجي يتضمن ثلاث خطوات رئيسية: قياس النشاط الكهربائي العام للدماغ، وتقديم محفزات موقوتة بدقة لإثارة استجابة، ثم استخدام تقنية رياضية لتوسيط الضوضاء وكشف شكل الموجة ERP الأساسي.
فكر فيها مثل محاولة سماع همسة شخص واحد في غرفة مزدحمة. بمفردها، تضيع الهمسة في الضوضاء. لكن إذا تمكنت من تسجيل هذا الشخص يقول نفس الكلمة مائة مرة وتوسيط التسجيلات، فإن الدردشة الخلفية العشوائية ستتلاشى، وسيصبح صوت الهمسة الثابت واضحًا. يعمل تحليل EEG ERP على مبدأ مشابه، مما يتيح لنا رؤية كيف يستجيب الدماغ للأحداث المحددة بدقة رائعة. هذه الطريقة أساسية للعديد من أنواع البحث الأكاديمي لأنها توفر نافذة مباشرة على العمليات المعرفية كما تحدث.
قياس النشاط الكهربائي للدماغ
الخطوة الأولى هي التقاط النشاط الكهربائي الخام للدماغ باستخدام التخطيط الكهربائي للدماغ، أو EEG. أدمغتنا نشطة باستمرار، حيث تطلق وتواصل مليارات الخلايا العصبية إشارات صغيرة. هذه الأنشطة التراكمية تولد إشارات كهربائية صغيرة يمكن اكتشافها على فروة الرأس. سماعة EEG، مثل Epoc X، تستخدم مستشعرات (إلكترودات) موضوعة على الرأس لالتقاط هذه الإشارات. النتيجة هي تدفق مستمر من البيانات التي تمثل النشاط المستمر والعفوي للدماغ. هذا EEG الخام هو الأساس للتحليل، لكنه يحتوي على كل نشاط الدماغ، وليس فقط الاستجابة لحدث معين.
التقاط استجابات مربوطة بالوقت لمحفزات
بعد ذلك، نقدم "حدثًا" أو "محفزًا" لمعرفة كيف يستجيب الدماغ. يمكن أن يكون أي شيء من عرض صورة أو تشغيل صوت إلى طلب من المشارك الضغط على زر. المفتاح هنا هو التوقيت. ERPs هي استجابات دماغية مربوطة بالوقت لحدث محدد. هذا يعني أننا نحتاج إلى معرفة اللحظة الدقيقة لتقديم المحفز. يتيح لك برنامج EmotivPRO إدراج مؤشرات موقوتة في تدفق بيانات EEG، لتحديد اللحظة الدقيقة التي يحدث فيها كل حدث. هذا يخلق ارتباطًا مباشرًا بين المحفز والنشاط الدماغي الذي يتبعه، وهو أمر أساسي للخطوة النهائية.
استخدام التوسيط للإشارات لتقليل الضوضاء
استجابة الدماغ لحدث واحد (ERP) صغيرة بشكل كبير وعادةً ما تكون مدفونة ضمن إشارة EEG الخلفية الأكبر بكثير. لاكتشافها، نستخدم تقنية تسمى التوسيط للإشارات. يتم تصميم التجربة بحيث يتعرض المشارك لنفس النوع من المحفز مرات عديدة. بعد ذلك، نأخذ الجزء الصغير من بيانات EEG مباشرة بعد كل محفز ونوسيط كل هذه الأجزاء معًا. نظرًا لأن النشاط الخلفي للدماغ عشوائي، فإنه يتوسط ويُلغي ذاته. ومع ذلك، فإن استجابة الدماغ للمحفز متسقة وتحدث في نفس الوقت بعد كل حدث. تبقى هذه الإشارة المتوسطة بعد التوسيط، مما يكشف عن شكل الموجة ERP النظيف.
ماذا تعني المكونات الرئيسية لـ ERP؟
بمجرد حصولك على شكل الموجة ERP المتوسط، الخطوة التالية هي التعرف على ميزاته الرئيسية، المعروفة بالمكونات. هذه المكونات هي قمم ووديان محددة في شكل الموجة التي تتوافق مع مراحل مختلفة من المعالجة الحسية والمعرفية. تُسمى عادة بحرف يحدد قطبيتها (P للإيجابية، N للسلبية) ورقم يشير إلى مدة تأخرها التقريبي، أو توقيتها، بالميلي ثانية بعد المحفز. على سبيل المثال، P300 هي ذروة متجهة نحو الإيجابية تحدث حوالي 300 ميلي ثانية بعد المحفز. دعونا نلقي نظرة على بعض المكونات الأكثر دراسة.
المكونات الحسية المبكرة (N100, P100)
تعكس مكونات ERP المبكرة المراحل الأولية واللاإرادية من المعالجة الحسية. على سبيل المثال، N100 هي ذروة سلبية تظهر حوالي 100 ميلي ثانية بعد محفز. تُعرف غالبًا بأنها "استجابة توجيهية" للدماغ لأنها تعكس الاكتشاف التلقائي لمحفز جديد أو غير متوقع مثل سماع صوت غير متوقع أو رؤية شيء غريب. يمكنك اعتباره رد فعل الدماغ الأولي "ما كان ذلك؟" قبل أن تقوم حتى بمعالجة الحدث بوعي. وبالمثل، P100 هي مكون إيجابي مبكر، غالبًا ما تتم دراسته في استجابة للمحفزات البصرية، الذي يعكس المعالجة الأولية في القشرة البصرية. توفر هذه الإشارات المبكرة نافذة على اللحظات الأولى لكيفية تسجيل أدمغتنا للعالم من حولنا.
المكونات المعرفية (P300, N400, P600)
ترتبط المكونات اللاحقة بوظائف معرفية أكثر تعقيدًا مثل الانتباه والذاكرة واللغة. P300 هي واحدة من أكثر الإمكانات المتعلقة بالأحداث شهرة، وتظهر عندما يتعرف شخص ما على محفز ذو معنى أو مرتبط بالمهمة. يمكن أن يشير اتساعها إلى مدى الانتباه الموجه، في حين يمكن أن يعكس تأخيرها سرعة معالجة المعلومات. يرتبط المكون N400 بقوة باللغة والمعنى. يظهر عندما يكتشف الدماغ عدم تطابق دلالي، مثل سماع الجملة: "أنا أتناول قهوتي مع الكريمة والجوارب." أخيرًا، يرتبط المكون P600 بالمعالجة التصريفية، ويظهر عندما يكتشف الدماغ أخطاء نحوية أو تراكيب جمل معقدة.
السلبية المتعلقة بالأخطاء والانتباه
بعض مكونات ERP لا ترتبط بمحفز خارجي ولكن بحدث داخلي، مثل ارتكاب خطأ. السلبية المتعلقة بالأخطاء (ERN) هي تذبذب سلبي حاد يحدث خلال 100 ميلي ثانية من القيام برد فعل خاطئ في مهمة ما. إنها كإشارة "آه، أفسدت!" داخلية، تعكس نظام الدماغ السريع لاكتشاف الأخطاء، غالبًا قبل أن تكون واعيًا بالخطأ. يمكن لمكونات ERP الأخرى أن تكشف عن كيفية تخصيصنا للانتباه. من خلال مقارنة استجابة الدماغ للمحفزات المهتمة مقابل المهملة، يمكن للباحثين رؤية كيفية معالجة الدماغ للمعلومات بشكل انتقائي وتصفيتها من الضوضاء، مما يوفر رؤى حول آليات السيطرة على الانتباه.
ما هو المعدات اللازمة لإجراء دراسة ERP؟
لبدء دراسة ERP، يجب اختيار الأدوات المناسبة للعمل. يتكون إعدادك من جزئين رئيسيين: المعدات الصلبة التي تلتقط إشارات الدماغ والبرامج التي تساعدك في فهمها. فكر فيه كبناء استوديو تسجيل عالي التقنية للدماغ. تحتاج إلى ميكروفون جيد (سماعة EEG) لالتقاط الصوت ولوحة مزج (البرمجيات) لتنظيفها وتحليلها. دعنا نستعرض القرارات الأساسية المتعلقة بالمعدات التي ستحتاج إلى اتخاذها.
اختيار سماعة EEG وإعداد الإلكترودات
نظام EEG هو أكثر من مجرد سماعة. فهو شامل للإلكترودات لالتقاط الإشارات الكهربائية للدماغ، ومكبرات لتقويتها، ومحولات لتحويلها إلى بيانات رقمية يمكن لجهازك قراءتها. العامل الحاسم هو عدد الإلكترودات، أو القنوات. بينما يمكن لبعض الدراسات العمل بعدد أقل من القنوات، فإن معظم البحث الأكاديمي يستفيد من كثافة أعلى من الإلكترودات (غالبًا 32 أو أكثر) للحصول على خريطة أكثر تفصيلاً لنشاط الدماغ.
تعتمد السماعة المناسبة بالكامل على سؤال بحثك. سماعتنا Insight ذات الخمس قنوات هي رائعة للأنماط البسيطة، بينما يوفر Epoc X ذو الأربع عشرة قناة تفاصيل مكانية أكثر. للحصول على تسجيلات عالية الكثافة تمنحك رؤية شاملة، فإن نظام Flex ذو القنوات الاثنين والثلاثين هو خيار رائع.
اختيار البرمجيات لجمع البيانات ومعالجتها
بمجرد حصولك على المعدات الصلبة، تحتاج إلى برنامج قوي لتسجيل، عرض، ومعالجة بيانات EEG. هذا هو المكان الذي يتم فيه تنظيف الإشارات الخام وتجهيزها لتحليل ERP. يجب أن يسمح لك البرنامج بتصفية الضوضاء، وإزالة الشوائب (مثل الوميض أو حركات العضلات)، وتجزئة البيانات حول أحداثك التجريبية.
صممنا EmotivPRO للتعامل مع هذه المهام بالضبط، مما يمنحك حلاً كاملًا لاكتساب البيانات وتحليلها مباشرةً من العلبة. لأولئك الذين يفضلون بناء خطوط تحليلهم الخاصة، فإن أنظمتنا متوافقة أيضًا مع بيئات البرمجة الشائعة مثل بايثون و MATLAB. يمكنك العثور على الأدوات التي تحتاجها لدمج معداتنا مع برمجياتك الخاصة على منصة المطورين الخاصة بنا.
الاختيار بين أنظمة الجل والملح
للحصول على إشارة نظيفة، تحتاج إلى وصل جيد بين إلكترودات EEG وفروة الرأس. يتم تحقيق ذلك عادةً باستخدام وسط موصل، في الأغلب محلول ملحي أو جل. توفر الأنظمة التقليدية المعتمدة على الجل وصلة مستقرة وجودة عالية، وهو مثالي للجلسات الطويلة. ومع ذلك، قد تكون فوضوية في الإعداد والتنظيف.
تقدم الأنظمة التي تعتمد على المياه المالحة بديلاً أكثر ملاءمة. فهي أسرع في الإعداد وأسهل كثيرًا في التنظيف، مما يجعل التجربة أكثر راحة للمشاركين. نحن نقدم كلا الخيارين مع سماعات Flex Saline و Flex Gel. غالبًا ما يعود الاختيار إلى موازنة متطلبات تجربتك مع الجوانب العملية للإعداد وراحة المشاركين.
كيفية إجراء دراسة تحليل EEG ERP
قد يبدو إجراء أول دراسة EEG ERP كبيرة، لكنها أكثر قابلية للإدارة عند تقسيمها إلى خطوات واضحة وقابلة للتنفيذ. تعتمد دراسة ناجحة على نهج منهجي، بدءًا من شرارة السؤال البحثي الأولية إلى التفسير النهائي لبياناتك. فكر في الأمر كبناء شيء: تحتاج إلى مخطط ثابت قبل أن تبدأ في وضع الأساس. التسرع في جمع البيانات دون خطة واضحة يمكن أن يؤدي إلى نتائج مربكة أو، أسوأ من ذلك، إلى بيانات لا تجيب في الواقع على سؤالك.
في هذا الدليل، سنستعرض المراحل الأربع الأساسية لإجراء دراسة تحليل ERP. أولاً، سنغطي كيفية تصميم تجربة قوية بفرضية واضحة. بعد ذلك، سنلقي نظرة على جوانب تحضير المشاركين وجمع بيانات EEG عالية الجودة. بعد ذلك، سنتعمق في خطوة بالغة الأهمية وهي معالجة بياناتك لتصفية الضوضاء والشوائب. أخيرًا، سنستكشف كيفية تحليل أشكال الموجة ERP واستنتاج استنتاجات ذات معنى. اتباع هذه الخطوات سيضمن أن تكون نتائجك موثوقة وغنية بالرؤية. وجود الأدوات المناسبة لواجهة الدماغ الحاسوبية يساعد في جعل هذه العملية أكثر سلاسة، مما يسمح لك بالتركيز أكثر على بحثك وأقل على العوائق التقنية.
تصميم تجربتك والنموذج
تصميم تجربتك هو أساسها. قبل أن تفكر حتى في وضع سماعة على أحدهم، تحتاج إلى فرضية واضحة. ما هو السؤال المحدد الذي تحاول الإجابة عليه؟ صمم دراستك لاختبار سلوك مكونات ERP معينة في استجابة لمحفزاتك مباشرةً. على سبيل المثال، إذا كنت تريد دراسة الانتباه، فيجب أن تكون المحفزات في الظروف 'الملاحظة' و'غير الملاحظة' متطابقة ماديًا. هذا التحكم يضمن أن أي اختلافات تراها في استجابة الدماغ ناتجة عن العملية الإدراكية للانتباه، وليس عن تباين في المحفز نفسه. الاستكشاف بدون فرضية يمكن أن يقودك إلى 'إعادة اكتشاف' آثار معروفة أو إلى بيانات فوضوية وغامضة.
تحضير المشاركين وجمع البيانات
بمجرد تحديد التصميم، حان وقت جمع البيانات باستخدام سماعة مثل Epoc X. مبدأ رئيسي في بحث ERP هو أنك تحتاج إلى العديد من المحاولات للحصول على إشارة نظيفة. استجابة الدماغ لحدث واحد صغيرة ومدفونة في نشاط كهربائي آخر. من خلال توسيط الاستجابات عبر العشرات أو حتى المئات من المحاولات، تلغي الضوضاء العشوائية، وتظهر الإمكانية المتعلقة بالحدث. من المهم أيضًا التحقق من نشاط الدماغ في 'فترة الأساس' قبل ظهور المحفز. إذا رأيت اختلافات كبيرة بين الظروف أثناء هذا الأساس، فهي إشارة تحذيرية أن بياناتك قد تكون لديها مشاكل تحتاج إلى معالجة قبل المتابعة مع تحليلك.
معالجة بياناتك وإزالة الشوائب
بيضانات EEG الخام نادرًا ما تكون مثالية. تحتوي على 'شائبات'، التي هي إشارات كهربائية ليست من الدماغ، مثل الوميض، وحركات العينين، أو توتر العضلات. هذه الإشارات يمكن أن تكون أكبر بكثير من الإمكانات المتعلقة بالأحداث التي تبحث عنها، لذا يلزم إزالتها. أفضل طريقة للتعامل مع ذلك هي تحديد وإزالة المحاولات التي تحدث فيها هذه الشوائب. ستستخدم أيضًا تقنيات مثل 'تصحيح الأساس'، حيث تطرح الجهد المتوسط من فترة ما قبل المحفز من كامل المحاولة. هذا يساعد على إزالة الانحرافات البطيئة في الإشارة. صمم برنامج EmotivPRO لمساعدتك في تنفيذ هذه الخطوات الأساسية للمعالجة المسبقة، وتنظيف بياناتك بحيث يمكنك الوثوق في نتائجك.
تحليل أشكال الموجة وتفسير النتائج
بعد المعالجة المسبقة، ستكون لديك أشكال موجة ERP نظيفة، التي تظهر قمماً وودياناً متميزة تسمى 'مكونات.' كل مكون، مثل P300 أو N400، يُعرف بتوقيته وقطبيته (إيجابي أو سلبي)، وموقعه على فروة الرأس. عند تحليل هذه المكونات، يكون من المغري فقط قياس النقطة الأكثر ارتفاعاً أو انخفاضاً لقمة، لكن هذا يمكن أن يكون مضللًا بسبب الضوضاء. طريقة أكثر قوة هي حساب متوسط السعة عبر نافذة زمنية محددة حيث يتوقع ظهور المكون. تفسير هذه المكونات في سياق تصميمك التجريبي هو المكان الذي يمكنك أخيرًا من الإجابة عن سؤالك البحثي والمساهمة في مجال البحث والتعليم الأكاديمي.
ما هي التطبيقات الرئيسية لتحليل EEG ERP؟
نظرًا لأن تحليل EEG ERP يمنحنا نظرة دقيقة على الجدول الزمني لمعالجات الدماغ، فقد أصبح أداة ذات قيمة في العديد من المجالات المختلفة. من المختبرات الأكاديمية إلى وكالات التسويق، يستخدم الباحثون ERPs للكشف عن رؤى كان من الممكن أن تظل مخفية. دعونا ننظر في بعض التطبيقات الأكثر شيوعًا ونرى كيف يتم استخدام هذه التقنية لدفع حدود ما نعرفه عن الدماغ البشري.
البحث الأكاديمي وعلم الأعصاب الإدراكي
في علوم الأعصاب الأكاديمية والإدراكية، تعتبر إمكانات ERPs أساسًا لدراسة كيفية عمل الدماغ الداخلي. فهي تساعد العلماء في فهم كيفية معالجة الدماغ للمعلومات، بدءًا من التصورات الحسية الأساسية إلى المهام الإدراكية المعقدة مثل اتخاذ القرار وفهم اللغة. نظرًا لأن الإمكانات المتعلقة بالأحداث تقدم رؤية لحظة بلحظة للنشاط العصبي، يمكن للباحثين تحديد التوقيت الدقيق للعمليات العقلية المختلفة. تتيح هذه الدقة لهم اختبار فرضيات محددة حول الانتباه، والذاكرة، والتعلم. على سبيل المثال، قد تكشف دراسة ERP عن مدى سرعة قدرة الدماغ على التفريق بين الأصوات المهمة وغير المهمة في بيئة صاخبة. صممنا حلولنا الصلبة والبرمجية لدعم هذا النوع من البحث والتعليم الأكاديمي المفصل، مما يجعل علوم الأعصاب المتقدمة أكثر سهولة.
التقييم السريري
تعمل إمكانات ERPs أيضًا كأداة مهمة في المجالات السريرية لتقييم وظيفة الجهاز العصبي. تقوم هذه الاختبارات بقياس الوقت الذي يستغرقه الدماغ للاستجابة للمحفزات الحسية المختلفة، مثل الأصوات أو الصور. من خلال تحليل توقيت وقوة هذه الاستجابات، يمكن للأطباء جمع بيانات موضوعية حول معالجة الشخص العصبية. يمكن لهذه المعلومات أن تساعد في الكشف عن عدم انتظام في كيفية عمل الجهاز العصبي وتقديم صورة أوضح عن التجربة اليومية للشخص. بينما لا يعد تحليل ERPs أداة تشخيصية بمفرده، إلا أنه يمكن أن يقدم رؤى قيمة تكمل التقييمات السريرية الأخرى، مما يساهم في فهم أكثر شمولاً للحالة الذهنية للشخص.
تطوير واجهة الدماغ الحاسوبية (BCI)
تجعل دقة إمكانات ERPs منها حجر الزاوية في تطوير واجهة الدماغ الحاسوبية الحديثة. تخلق أنظمة BCI مسار اتصال مباشر بين الدماغ وجهاز خارجي، مثل الكمبيوتر أو الطرف الاصطناعي. يمكن ترجمة النشاط الكهربائي للدماغ الناتج عن إطلاق الخلايا العصبية إلى أوامر. على سبيل المثال، يتم استخدام المكون P300، الذي يظهر عندما يتعرف المرء على محفز نادر أو مهم، غالبًا في تطبيقات "كُتاب P300". من خلال التركيز على حرف معين على الشاشة، يمكن للمستخدم توليد استجابة P300 يترجمها واجهة الدماغ الحاسوبية لكتابة ذلك الحرف. هذا التطبيق يوضح كيف يمكن تسخير إمكانات ERPs لإنشاء تقنيات مساعدة قوية.
التسويق العصبي وتحليل المستهلكين
في عالم التسويق العصبي، توفر إمكانات ERPs نافذة إلى العقل اللاواعي للمستهلك. تعتمد الطرق التقليدية مثل الاستطلاعات على ما يقوله الناس أنهم يشعرون به، لكن إمكانات ERPs يمكنها التقاط ردودهم الحقيقية وغير المفلترة على الإعلانات والمنتجات والشعارات التجارية. من خلال تحليل كيفية معالجة الدماغ للمعلومات البصرية والسمعية من المواد التسويقية، يمكن للشركات الحصول على رؤى موثوقة حول ما يجذب الانتباه حقًا ويثير الاستجابة العاطفية. هذا ذو قيمة كبيرة لفهم سلوك المستهلك واتخاذ قرارات مبنية على البيانات حول الحملات الإبداعية وتصميم المنتجات. يمكن أن تساعد إمكانات ERPs في الإجابة عن أسئلة مثل: "هل استحوذ هذا الشعار على انتباههم؟" أو "هل كانت الرسالة الرئيسية في إعلاننا لها صدى؟"
ما هي إيجابيات وسلبيات تحليل EEG ERP؟
مثل أي طريقة علمية، يمتلك تحليل EEG ERP نقاط قوة وضعف. فهم هذه النقاط الأساسية في تصميم دراسة قوية وتفسير النتائج بدقة. من ناحية، يقدم تحليل EEG ERP دقة مذهلة في التوقيت، مما يسمح لك برؤية العمليات الدماغية تتكشف في الوقت الحقيقي. من ناحية أخرى، لديه بعض القيود التي يجب مراعاتها. دعونا نستعرض أبرز الإيجابيات والسلبيات حتى تشعر بالثقة في نهجك لاستخدام هذه التقنية القوية.
إيجابية: توقيت ممتاز وفعالية من حيث التكلفة
أكبر ميزة لـ ERPs هي دقتها الزمنية الرائعة. نظرًا لأنك تقيس مباشرة النشاط الكهربائي للدماغ، يمكنك رؤية التغييرات تحدث من ميلي ثانية إلى أخرى. تجعل هذه الدقة الزمنية EmotivPRO مثالية لدراسة العمليات الإدراكية السريعة مثل الإدراك وفهم اللغة والانتباه. لا يوجد أي طريقة تصوير دماغ غير تدخلية أخرى تقترب من هذا المستوى من دقة التوقيت. مقارنة بتقنيات التصوير العصبي الأخرى مثل fMRI أو MEG، فإن إعداد دراسة بحث أكاديمي باستخدام EEG يكون أكثر اقتصاديا بكثير، مما يجعله متاحًا لمجموعة واسعة من المشاريع والمختبرات.
سلبية: قيود مكانية ومشكلة الانعكاس
بينما تخبرك إمكانات ERPs متى يحدث الحدث العصبي بدقة كبيرة، يكون من الصعب معرفة أين تحديدًا في الدماغ ينشأ. تتشوه الإشارات الكهربائية التي تنشأ داخل الدماغ وتنشر أثناء مرورها عبر أنسجة الدماغ والجمجمة وفروة الرأس. محاولة تحديد الأصل الدقيق لإشارة سجلت على فروة الرأس هو تحدٍ معروف باسم "مشكلة الانعكاس." بينما يمكن أن توفر سماعة ذات قنوات أكثر، مثل Flex Saline، معلومات مكانية أفضل، إلا أن إمكانات ERPs ليست الأداة المثالية إذا كان سؤالك البحثي الأساسي يتعلق بتحديد وظيفة الدماغ.
سلبية: شوائب الإشارة والتأكد من الجودة
تكون إشارتك EEG حساسة، وليس فقط للنشاط الدماغي. الأشياء البسيطة مثل الرمش أو تحريك العينين أو شد الفك يمكنها أن تخلق إشارات كهربائية كبيرة تدعى شوائب يمكنها بسهولة تلوث بياناتك. غالبًا ما تكون هذه الشوائب أكبر بكثير من إمكانات ERPs الصغيرة التي تحاول قياسها، لذا يمكن أن تخفي أو تشوه نتائجك. أفضل طريقة للتعامل مع ذلك هي إزالة المحاولات التي تحتوي على هذه الشوائب بعناية أثناء معالجة البيانات المسبقة. يتضمن برنامج EmotivPRO أدوات لمساعدتك في تحديد وإدارة هذه الشوائب، مما يضمن أنك تبقى مع بيانات عالية الجودة لتحليلك.
سلبية: الفروق الفردية في النشاط الدماغي
لا يوجد دماغان متطابقان تمامًا، وتظهر هذه الاختلافات في بيانات ERP. لدى الناس اختلافات فردية في شكل الدماغ، وسمك الجمجمة، وحتى طرق مختلفة لمعالجة المعلومات، وكل ذلك يمكن أن يؤثر على مكونات ERP. هذا يعني أنك سترى تنوعًا طبيعيًا من مشارك إلى آخر، حتى في الاستجابة لمحفز بسيط. من المهم أن تكون واعيًا بهذا التباين عند تصميم دراستك. إن ضمان وجود عدد كافٍ من المشاركين واستخدام الطرق الإحصائية المناسبة أمر حاسم لضمان أن نتائجك تعكس تأثيرات إدراكية حقيقية وليس مجرد تفردات فردية.
مفاهيم خاطئة شائعة حول تح解析 EEG ERP
يعتبر تحليل الإمكانات المرتبطة بالأحداث أداة مفيدة جدًا، لكن مثل أي طريقة علمية، تحتوي على تفاصيل دقيقة. يمكن أن تظهر بعض الفهم الخاطئ الشائعة، خاصة لأولئك الجدد في هذا المجال. التغلب على هذه التشويشات المحتملة أساسي لتصميم تجارب قوية واستنتاج استنتاجات دقيقة من بياناتك. دعونا نتناول بعض الفهمات الخاطئة الأكثر شيوعًا حتى تتمكن من الاقتراب من دراسات ERP بثقة.
خلط المثيرات الفيزيائية بالتأثيرات الإدراكية
من السهل الوقوع في فخ خلط الاختلافات الفيزيائية في المحفزات مع التأثيرات الإدراكية التي تريد قياسها. على سبيل المثال، إذا كنت تدرس الانتباه، تحتاج إلى التأكد من أن المحفزات التي تقدمها في ظروف 'الملاحظة' و'عدم الملاحظة' متطابقة فيزيائيًا. إذا كان واحد من المحفزات أكثر سطوعًا أو أعلى صوتًا أو أكبر من الآخر، فإن الاختلافات التي تراها في شكل موجة ERP قد تكون مجرد الدماغ يتفاعل مع تلك الخصائص الفيزيائية، وليس تأثيرات الانتباه. تصميم التجربة القوي يضمن أن الشيء الوحيد الذي يتغير بين الظروف هو المهمة الإدراكية التي تحقق فيها.
تجاهل توقيت المحفز وERP الناتج
يهم توقيت تجربتك بشكل كبير. إذا قدمت المحفزات بسرعة كبيرة معًا، يمكنك مواجهة مشكلة تسمى ERP الناتج. فكر فيها كفترة برودة قصيرة لاستجابة الدماغ. عندما تظهر المحفزات بتتابع سريع، يمكن أن تكون استجابة الدماغ للمحفز الثاني أو الثالث أصغر بكثير، خاصة للمكونات الحسية المبكرة مثل N1 وP2. يمكن أن تستمر هذه الفترة الحرجة لأكثر من ثانية. إذا كان توقيتك سريعًا جدًا، فإن إمكانات ERPs الناتجة قد لا تعكس بدقة العملية الإدراكية التي تدرسها. إنها قيد فيزيولوجي وليس إدراكي، لذا من الضروري ضبط فترات المحفز بشكل مناسب.
تبسيط ما تعنيه مكونات ERP
من المغري إعطاء معنى واحد بسيط لمكون ERP معين، مثل القول بأن "P300 دائمًا يعني المفاجأة." رغم أن ذلك يمكن أن يكون نقطة انطلاق مفيدة، إلا أنه تبسيط مخل. كل مكون يتم تعريفه بعدة خصائص: قطبيته (إيجابية أو سلبية)، توقيته بعد المحفز، وأين يظهر على فروة الرأس. يمكن أن يتغير معنى هذه المكونات ERP بناءً على المهمة المحددة. يتطلب تفسير دقيق النظر في السياق الكامل للتجربة بدلاً من مجرد تطبيق تسمية بسيطة. هذا يساعدك في فهم القصة الغنية التي ترويها بياناتك حول المعالجة الإدراكية.
مقالات ذات صلة
أسئلة شائعة
ما هي أبسط طريقة لفهم الفرق بين EEG و ERP؟ فكر في EEG وكأنك تستمع إلى جميع المحادثات التي تجري في متجر قهوة مزدحم دفعة واحدة. إنه النشاط الكهربائي الشامل والمستمر للدماغ. بينما ERP، من ناحية أخرى، مثل عزل اللحظة التي يستجيب فيها الجميع في المتجر لحدث معين، مثل تحطم صاخب. نقوم بتوسيط تلك الاستجابة المحددة على العديد من المثيلات لتصفية الضوضاء الخلفية، مما يتركنا بإشارة واضحة لكيفية معالجة الدماغ لهذا الحدث الفردي.
كم مرة أحتاج إلى عرض محفز للحصول على إشارة ERP واضحة؟ لا يوجد رقم سحري واحد، حيث يعتمد الأمر على مدى قوة استجابة الدماغ للمحفز الخاص بك. للحصول على استجابات حسية مبكرة وواضحة جدًا، قد تحصل على إشارة جيدة مع ما لا يقل عن 40 أو 50 محاولة لكل حالة. للحصول على مكونات معرفية أكثر دقة وتعقيدًا، من المحتمل أن تحتاج إلى التخطيط لمائة محاولة أو أكثر لتوسيط الضوضاء بفعالية ورؤية شكل الموجة الأساسي.
هل يمكنني استخدام تحليل ERP لمعرفة ما يفكر فيه أو يشعر به شخص ما؟ لا، تحليل ERP لن يسمح لنا برؤية محتوى أفكار شخص ما. يظهر لنا توقيت وتسلسل كيفية معالجة الدماغ للمعلومات. على سبيل المثال، يمكننا أن نرى أن الدماغ سجل كلمة غير متوقعة في جملة، لكن لا يمكننا معرفة الكلمة التي كان يتوقعها الشخص بدلاً من ذلك. إنها أداة لفهم آليات الإدراك، وليس لتفسير الأفكار أو المشاعر المحددة.
أي سماعة من Emotiv يجب أن أختارها لدراسة ERP؟ تعتمد أفضل سماعة حقًا على تعقيد سؤال بحثك. سماعة Insight ذات الخمس قنوات هي نقطة انطلاق رائعة للتجارب البسيطة جدًا مع مكونات ERP واضحة جدًا. للدراسات الأكثر تفصيلاً حيث يكون موقع استجابة الدماغ مهمًا، توفر سماعة Epoc X ذات الأربع عشرة قناة معلومات أكثر دقة. إذا كان عملك يتطلب خريطة شاملة وعالية الكثافة للنشاط الدماغي، فإن نظام Flex ذو القنوات الاثنين والثلاثين هو الخيار المثالي.
ما هو الخطأ الأكثر شيوعًا الذي يرتكبه المبتدؤون عند بدء دراسة ERP؟ الفخ الأكثر شيوعًا هو عدم وجود تصميم تجريبي مضبوط تمامًا. من السهل الفصل عن التصميمات الفيزيائية لمحفزاتك، على سبيل المثال، جعل صورة واحدة أكثر سطوعًا قليلاً من الأخرى. عندما يحدث ذلك، لا يمكنك التأكد مما إذا كانت الاختلافات في بيانات ERP ناتجة عن العملية الإدراكية التي تدرسها أو فقط برد فعل الدماغ على ذلك التغيير الفيزيائي. التصميم القوي والمضبوط هو الجزء الأكثر أهمية من أي دراسة ناجحة.