1. Introduction
Welcome! In this tutorial we’re learning about brain waves and how we can use them to understand the brain and behaviour.
Hans Berger coined the term electroencephalogram in 1929, when he described changes in electrical potentials recorded using sensors placed on a person’s head. He identified two types of brain waves, which he termed alpha and beta waves simply because of the order in which he recorded them. Such waves had been recorded in other mammals but Berger had described them in humans for the first time!
Since then, the electroencephalography method has become a key tool in neuroscience and has helped to evolve our understanding of brain waves (which researchers call neural oscillations) and has helped to characterize states in the brain such as fatigue and wakefulness.
In this brief tutorial we will cover the following:
- What are neural oscillations?
- How can we measure neural oscillations?
- What can we do with neural oscillations?
- Practical application using Emotiv devices and software.
2. What is EEG?
Electroencephalography (EEG) is a non-invasive and passive method of measuring the electrical activity of our brain. Electrodes/sensors/channels are placed on the scalp to record electrical activity that is generated by populations of brain cells, called neurons.

Fig. 1 – Neurons produce electrical activity which can be detected with an EEG device [Siuly, et al. (2016)].
2.1. EEG Systems
There are many EEG devices in the market that can be used to record an EEG. EEG devices can range from having:
- A single sensor or up to 256 electrodes – More electrodes would yield a higher spatial resolution of information over the scalp.
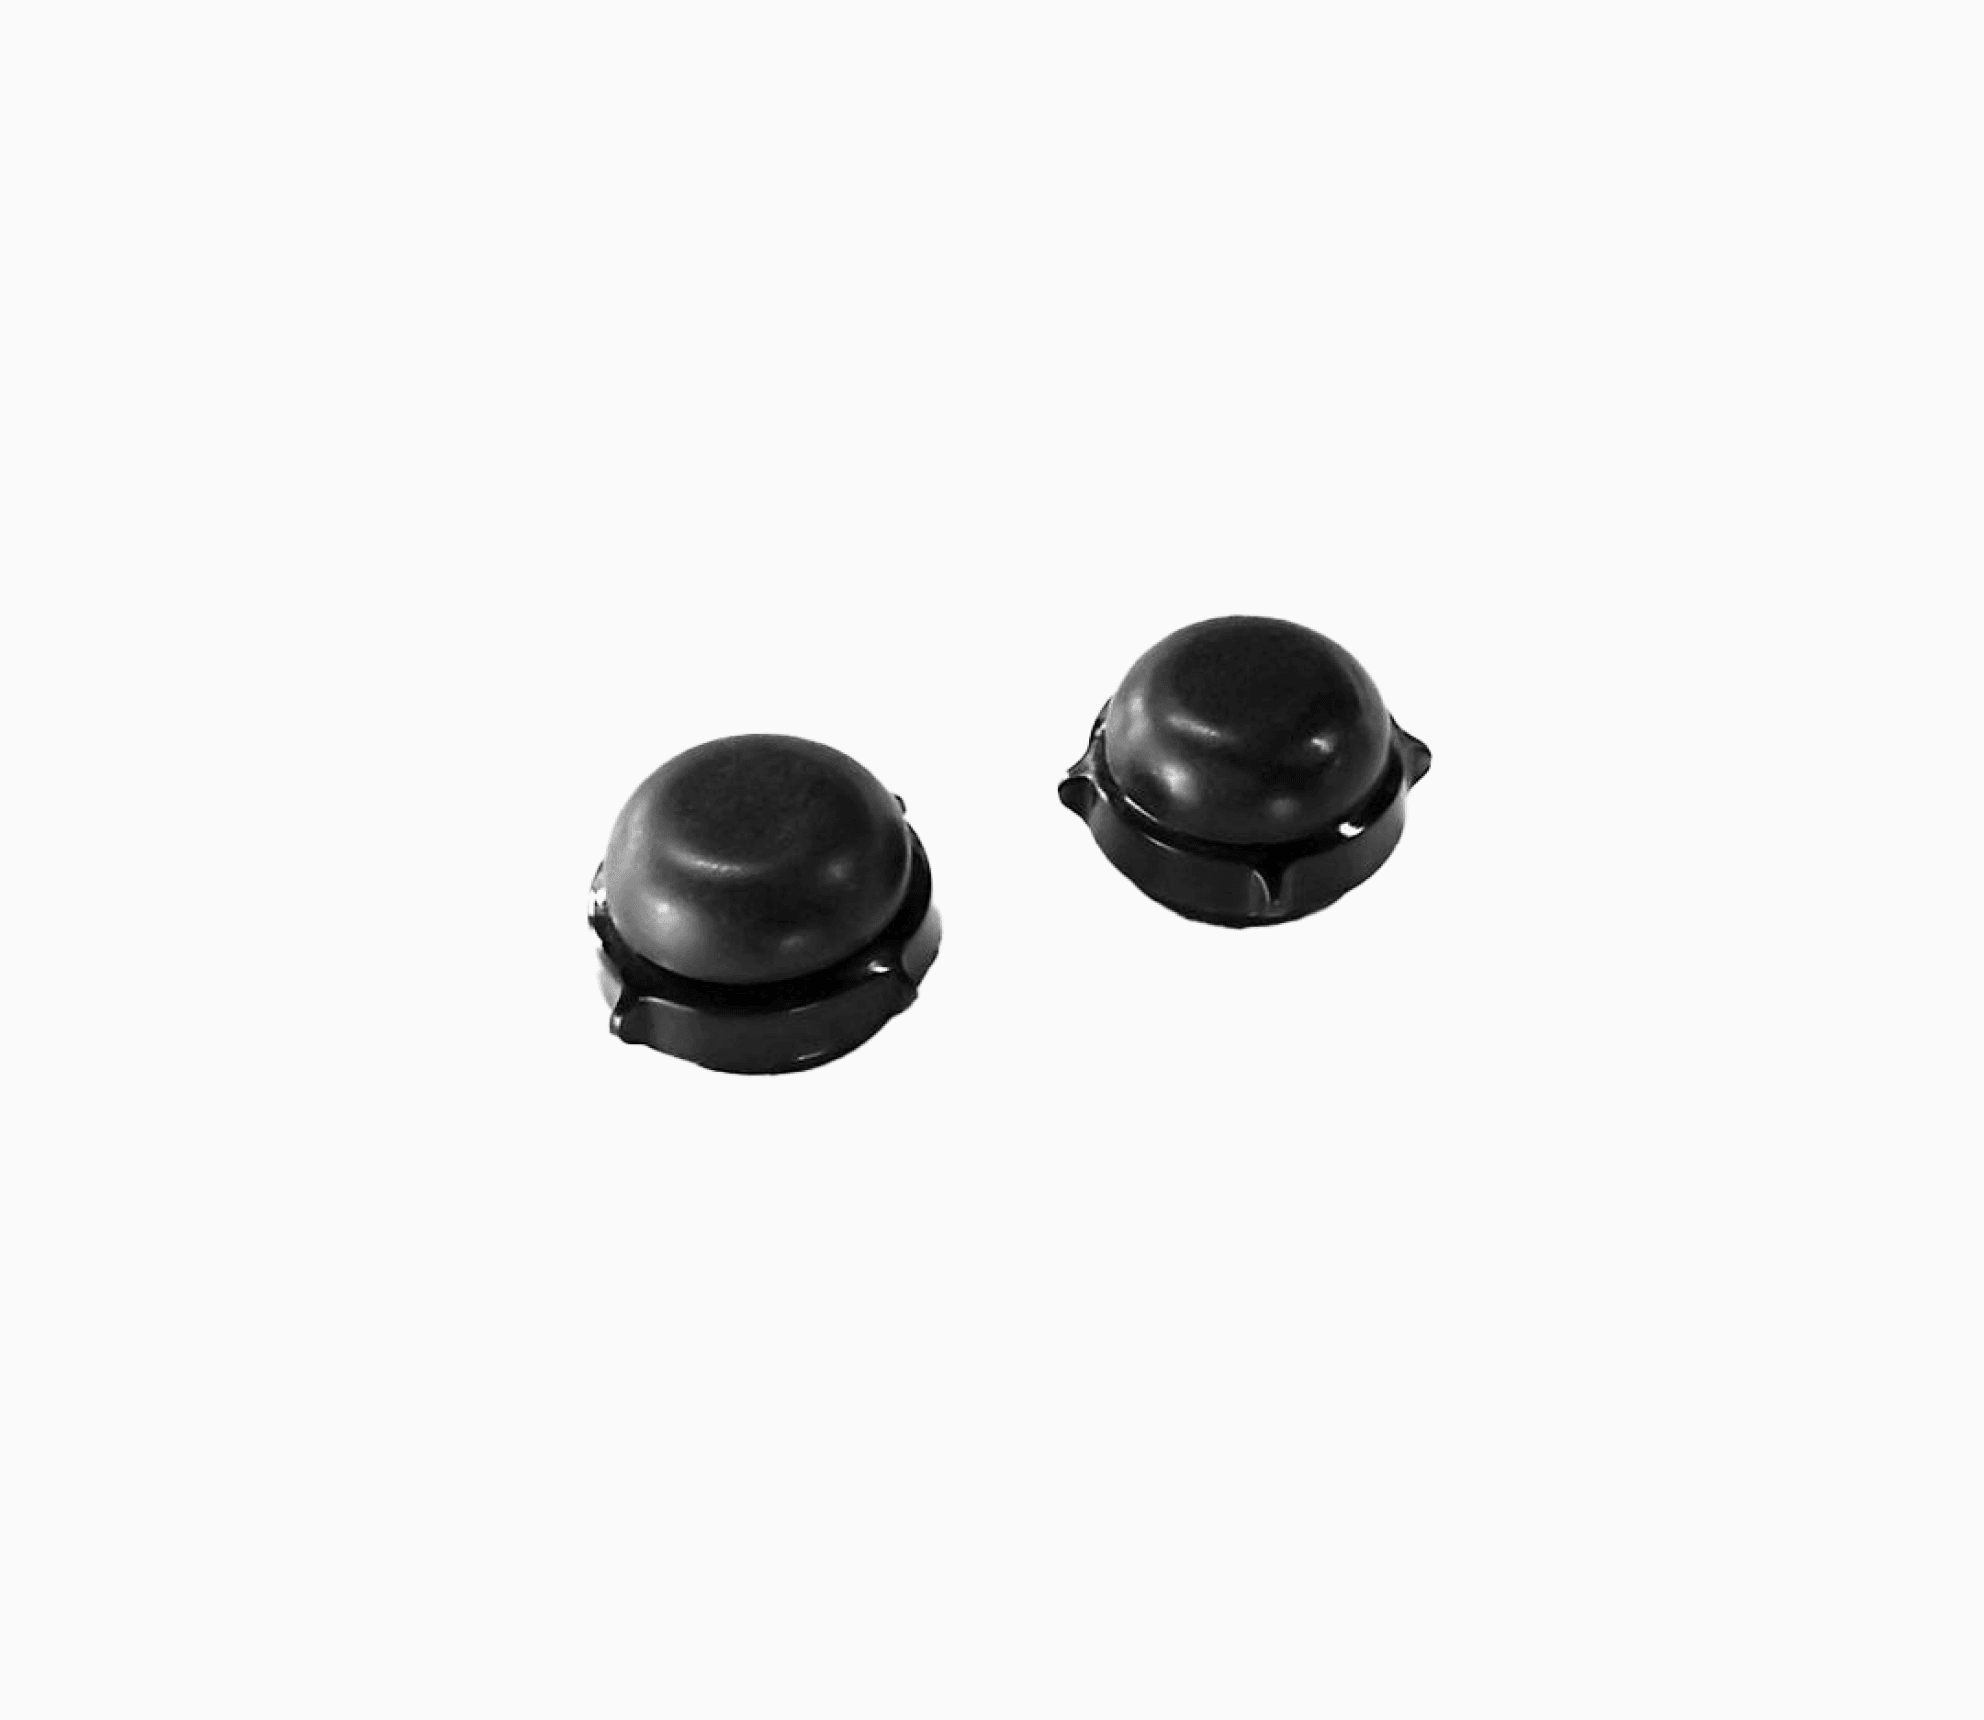
- Wet or dry electrodes – Wet electrodes use a electrolytic gel or saline solution to improve conductance between the scalp and the sensor. Dry electrodes can be metal or conductive polymers which need direct contact with the scalp.
- Active or passive electrode – Passive electrode systems simply conduct the signal to the device where it is amplified. Active electrode systems amplify the signal at each electrode before it reaches the device for amplification. This reduces environmental electrical noise in the signal.
- Wired or wireless devices which transmit data via Bluetooth.

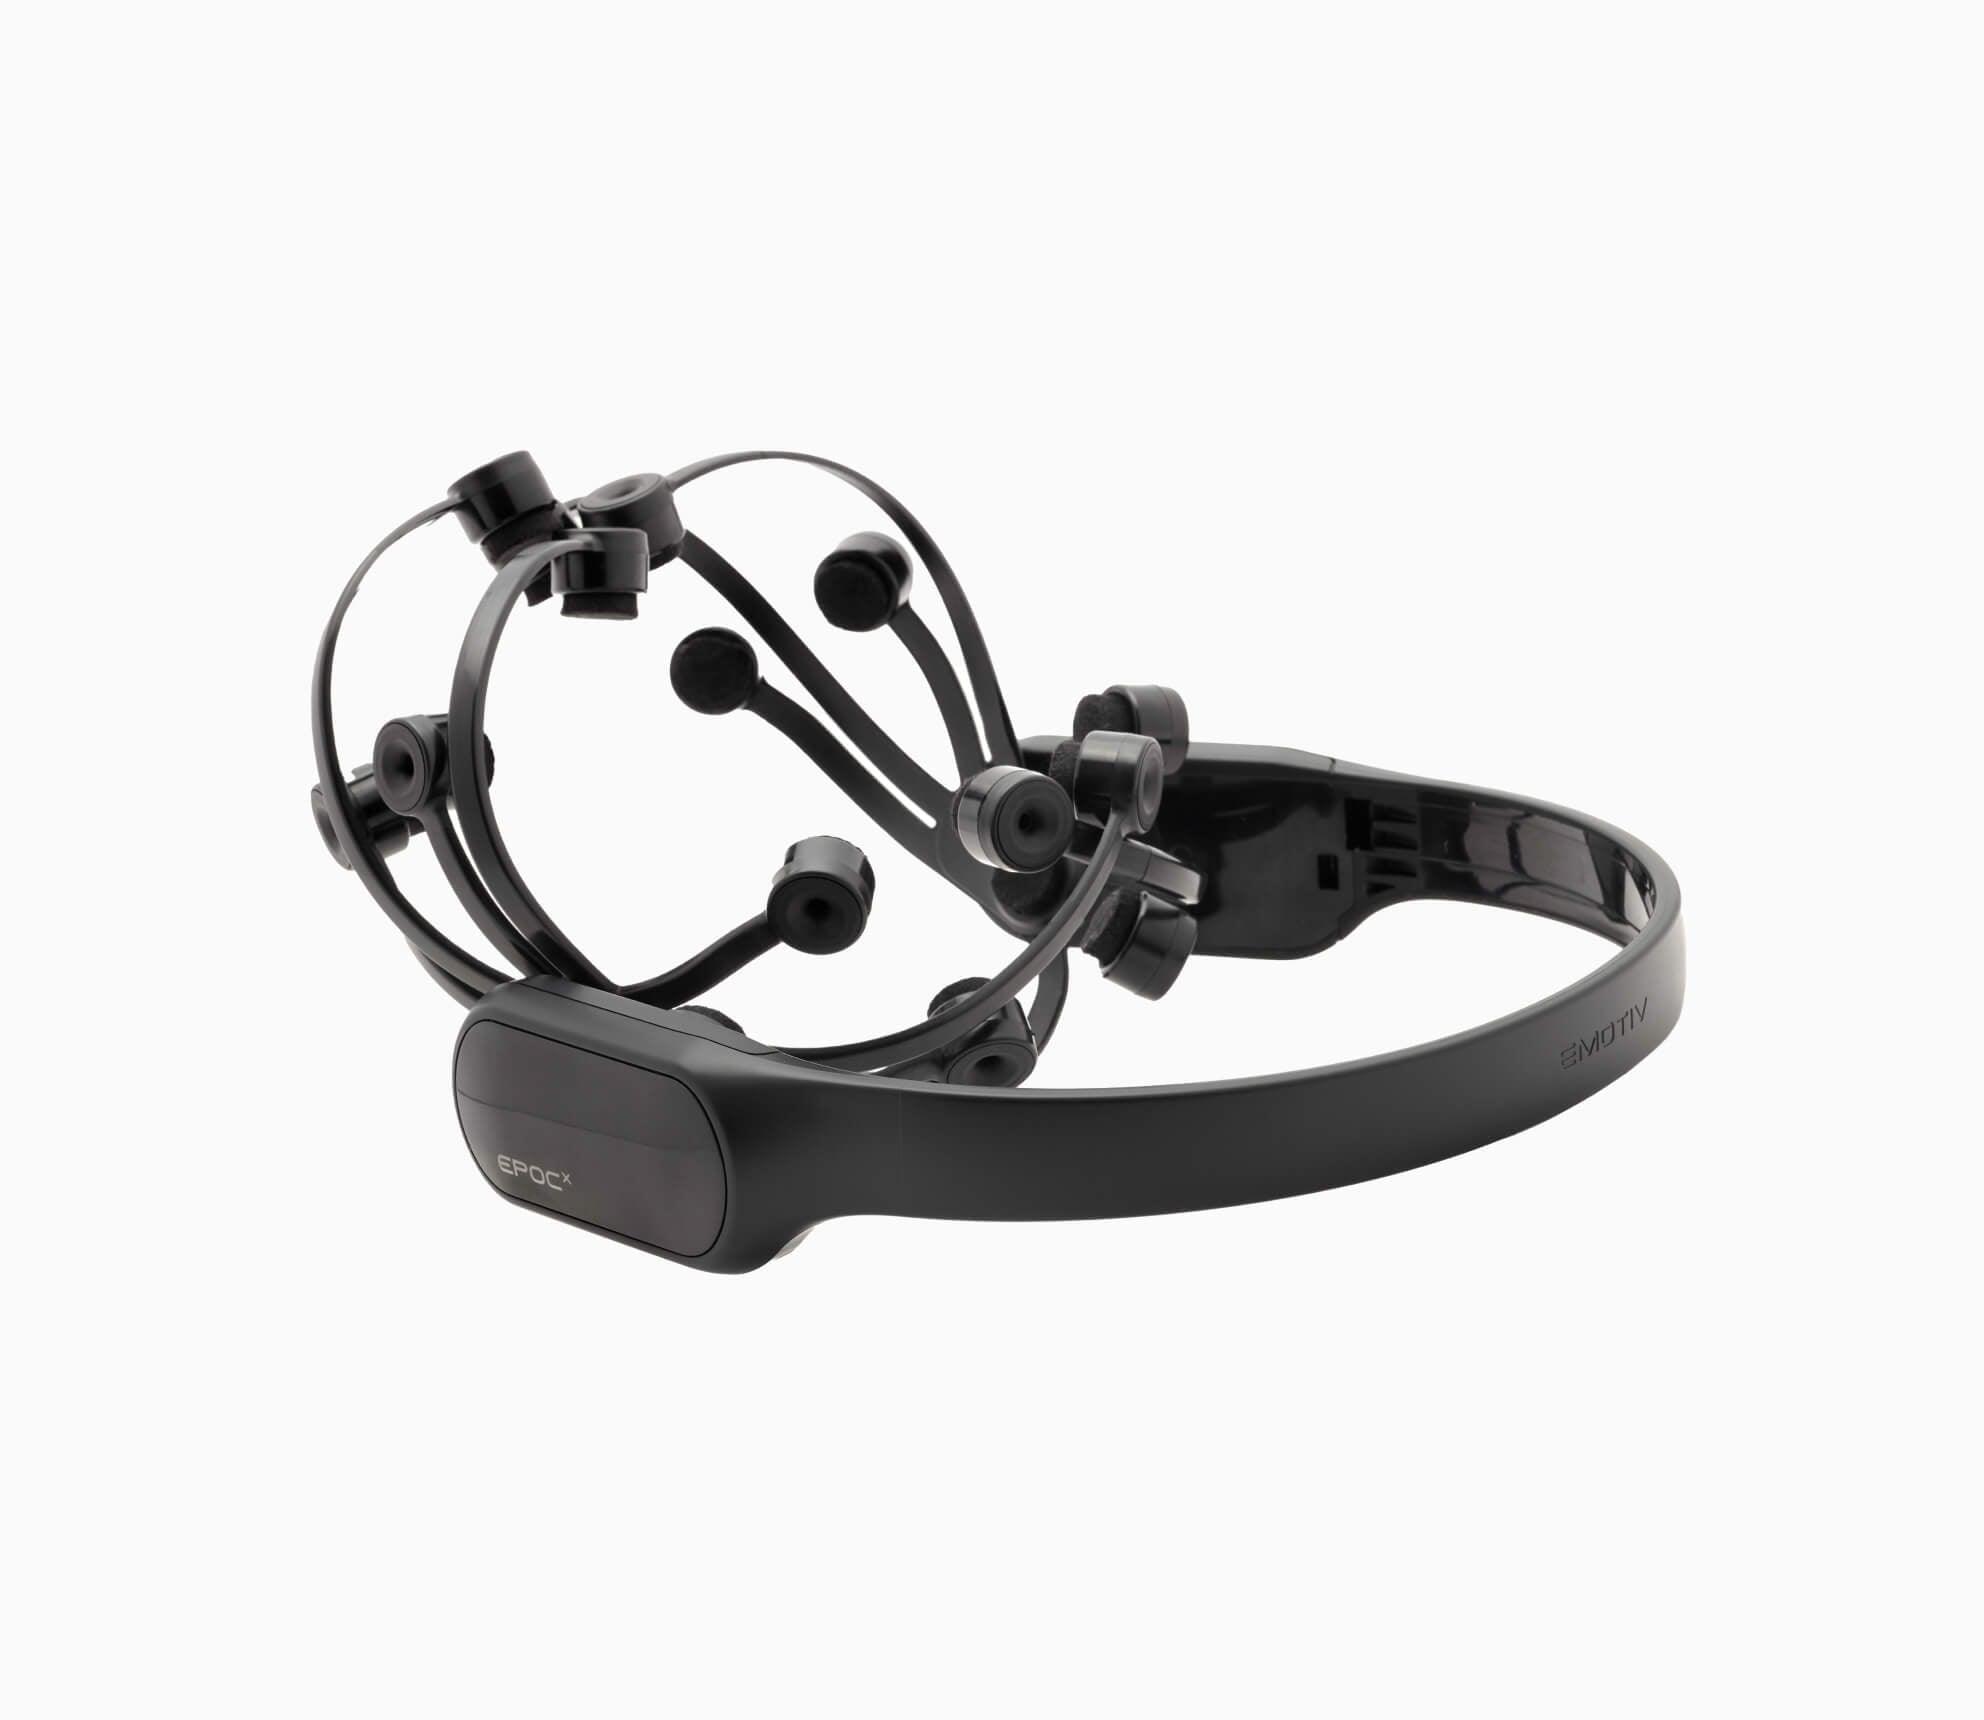
Fig. 2 – A wireless, low density EEG system.
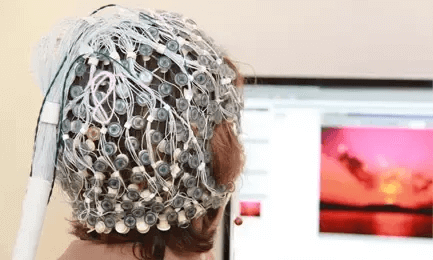
Fig. 3 – A wired, high density electrode EEG system.
2.2. When to use EEG?
Each neuroimaging method can help answer different research questions.
EEG’s biggest strength is that it can measure neural activity in scale of milliseconds, which can measure pre-conscious processes.
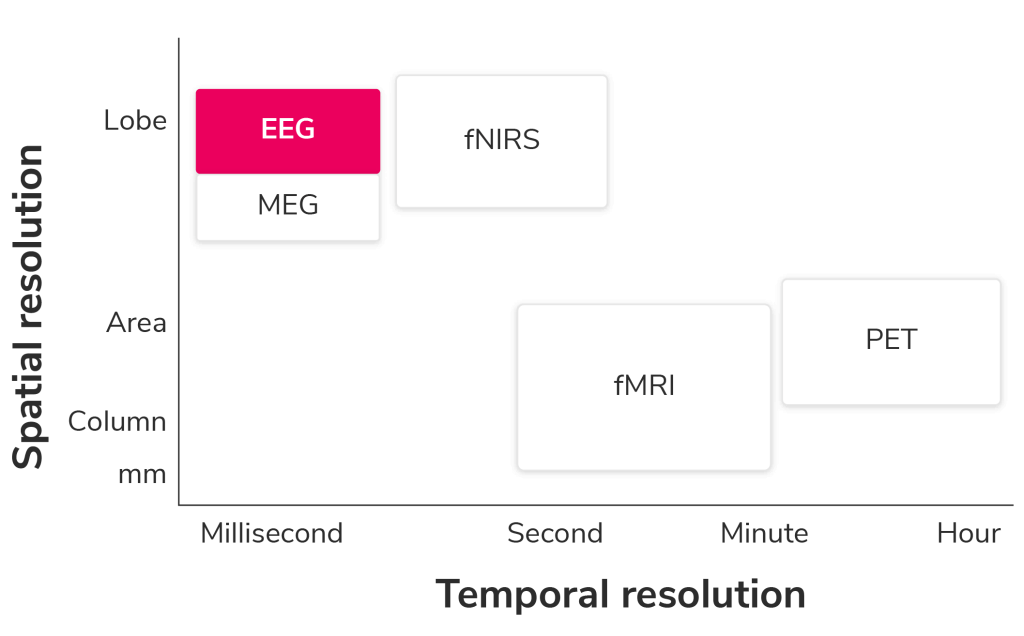
Fig. 4 – Spatial vs temporal resolution of different neuroimaging tools.
It is best suited for questions such as “which parts of my video did participants pay attention to the most?”
EEG records activity mainly from the outer layers of the brain (i.e. has low spatial resolution). With a single sensor it is impossible to identify the source of the activity. Recording with a large number of channels can allow to mathematically reconstruct the source but it is still limited in identifying deep sources. Functional magnetic resonance imaging (fMRI) is better suited to answer questions such as “Which part of the brain is related to changes in attention?”
2.3. Sensor to raw EEG?
Once an EEG device is fitted on the head, brain activity is measured at a single sensor as the difference in amplitude between that sensor and a reference sensor. In most EEG systems this is called the common mode sense (CMS) electrode. An additional sensor, the driven right leg (DRL), helps to reduce any interference at the CMS.

Fig. 5 – Simplified block diagram of EEG signal transmission.
In systems with both active and passive electrodes the signal is then amplified and low-pass filtered. Low pass filtering is a step which will remove possible electrical interferences from the environment in your signal e.g. main lines power.
These steps happen in the hardware itself before the raw EEG signal can be viewed on your computer screen.
2.4. Some Basic Terminology
10-20 standard naming convention
Left sensors are usually odd numbered and right sensors usually even numbered.
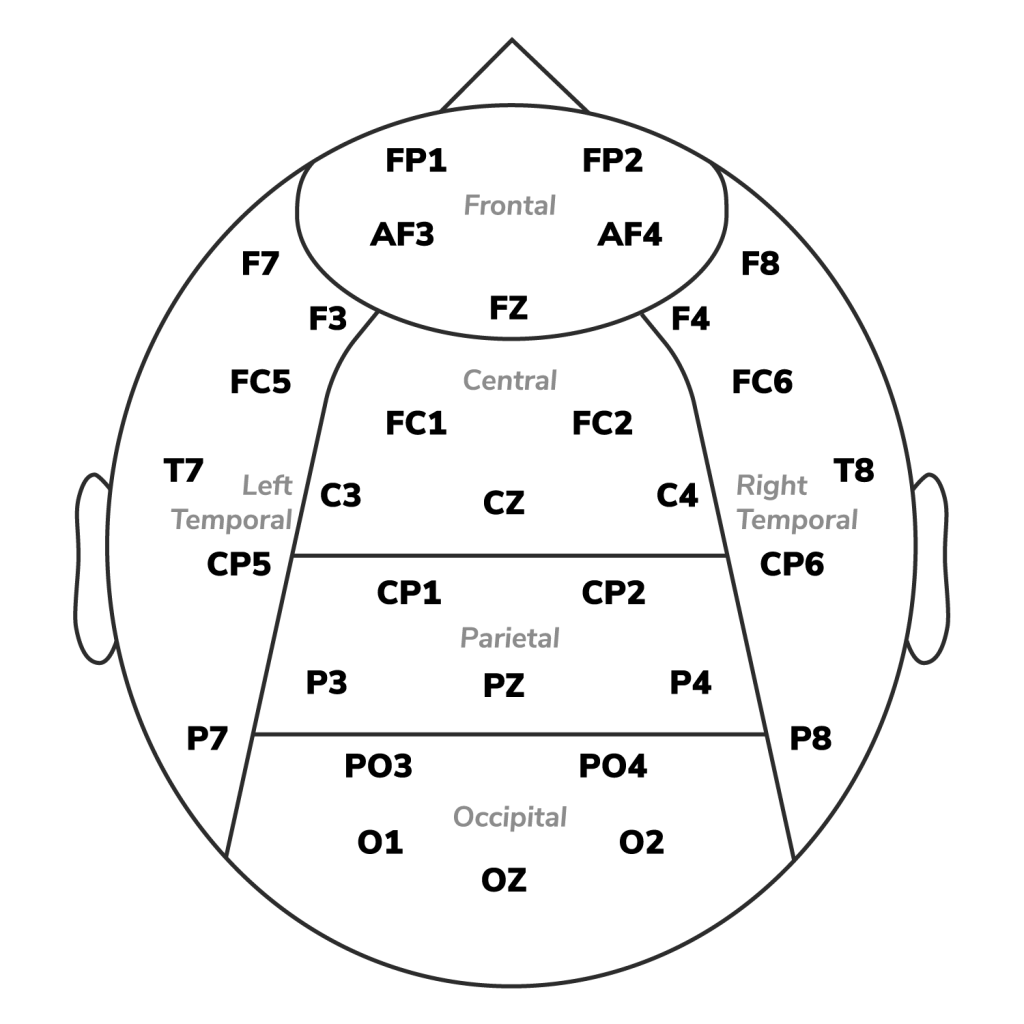
Note 1: these are just naming conventions and the source of the EEG sensor location is not an indicator of the source of the activity.
Note 2: additional steps such as mathematical reconstruction of the source needs to be undertaken to determine the source of the activity at a single channel.
3. What are Neural Oscilations?
Brain waves, often referred to as neural oscillations, are rhythmic patterns produced by a single or cluster of neurons.
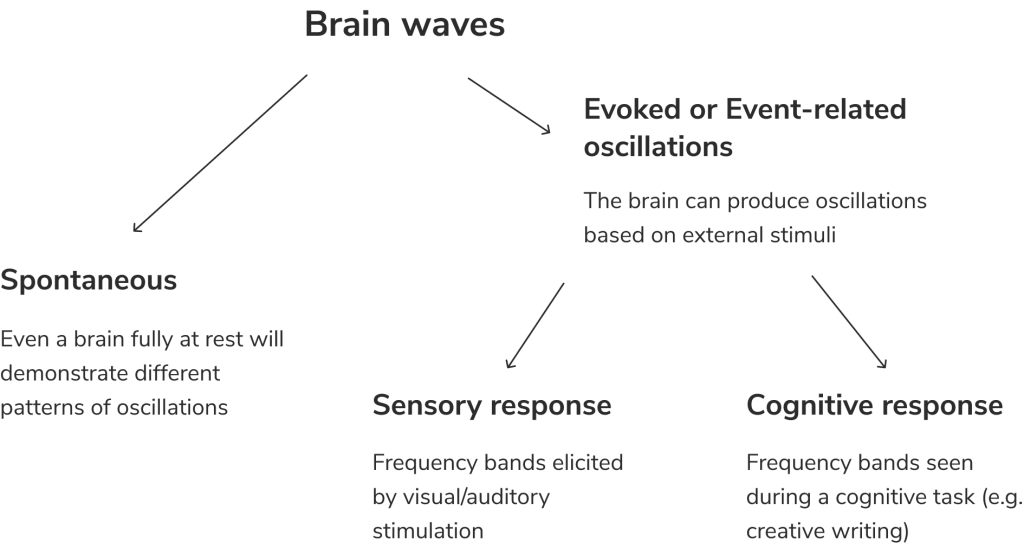
It’s not yet clear why the brain produces these different types of oscillations, though there are many theories. Researchers use different tasks to characterize these oscillatory activities and aim to understand the mysteries of the brain using these rhythmic patterns.
3.1. Some properties of an oscillation
This figure shows a measurement of a regular electrical signal:
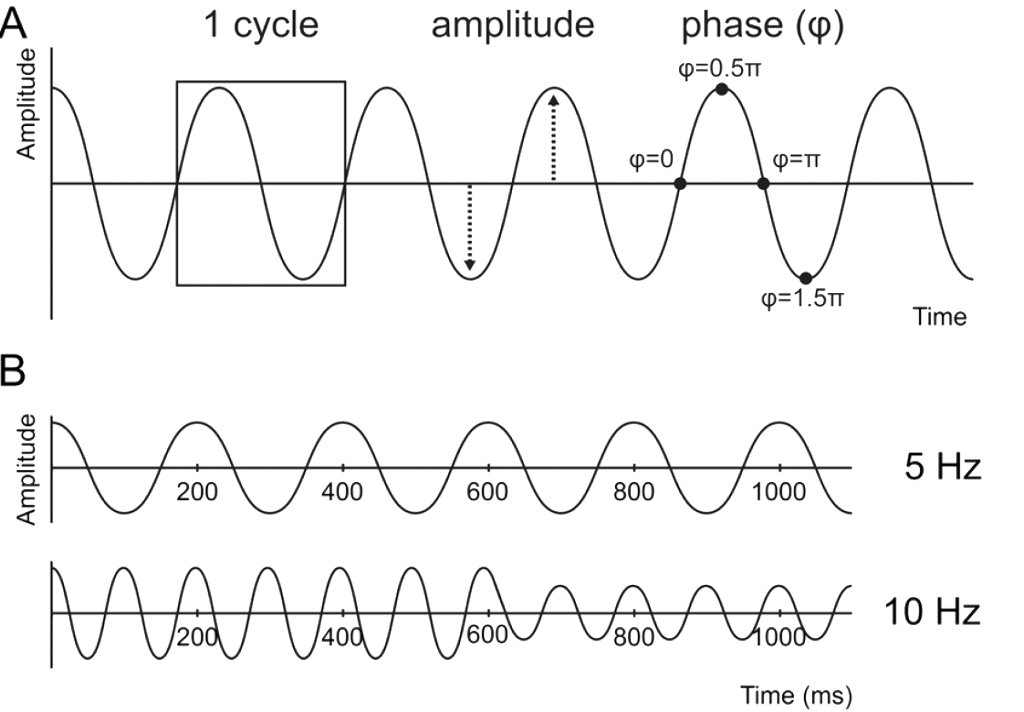
Fig. 6 – Spatial vs temporal resolution of different neuroimaging tools.
On the left (y-axis) we can plot amplitude of the electrical recording and on the horizontal axis (x-axis) the time. The amplitude of the signal will vary in magnitude in a regular manner about a central point. One cycle is also referred to as an oscillation.
The number of cycles per second is called the frequency of the wave and the unit is Hertz (Hz). So 1 cycle per second = 1 Hz. Amplitudes are typically measured in microvolts (µV).
In the brain we see waves with frequencies ranging from 0.2 Hz (very slow waves) to 80 Hz or more (very fast waves). High-frequency activity up to 500 Hz associated with seizures can also been recorded in the brain.
Different types of brain oscillations are characterized based on their frequency. These are known as frequency bands and can be related to different brain states:

Fig. 7 – Brain waves in typical EEG.
3.2. Why are different frequency bands important?
-
Identifying normal vs abnormal brain patterns
Neural oscillations are important for detecting seizures and diagnosing Epilepsy in Neurology.
-
Brain computer interfaces (BCI)
The amount of beta, gamma, and mu oscillations are often used to train remote devices (e.g. move a wheelchair with thoughts).
-
Neurofeedback
This is a form of brain training where you can view your brain waves (e.g. gamma oscillations) and engage in cognitive tasks to improve the amount of gamma oscillations in your brain.
-
Neuromarketing
Alpha and beta frequency bands can be used to determine which part of an advertisement is more or less engaging.
3.3. Types of EEG data analysis
Most commonly researchers conduct analysis in either the time domain or the frequency domain.
-
Time domain analysis
Typically measures the voltage amplitude at time points of interest after the onset of a stimulus. These are called event-related potentials (ERPs).
-
Frequency domain analysis
Typically measures the amount of neural oscillations in different frequency bands in a defined time window or related to the onset of an event.
Next we provide an overview of frequency domain analysis.
3.4. Processing
Once you make an EEG recording, you typically clean the data before making sense of oscillations.
-
Filtering
A technique to remove high and low frequency environmental noise in the data.
-
Artefact Removal
Physical movement, eye blinks can all cause large artefacts (> 50 µV peaks in the EEG). These can be removed so they do not influence our results. Some researchers use sophisticated methods to correct these artefacts to preserve data.
After the data has been processed, the signal can now be converted to frequency domain so that we can quantity the amount of each type of brain waves.
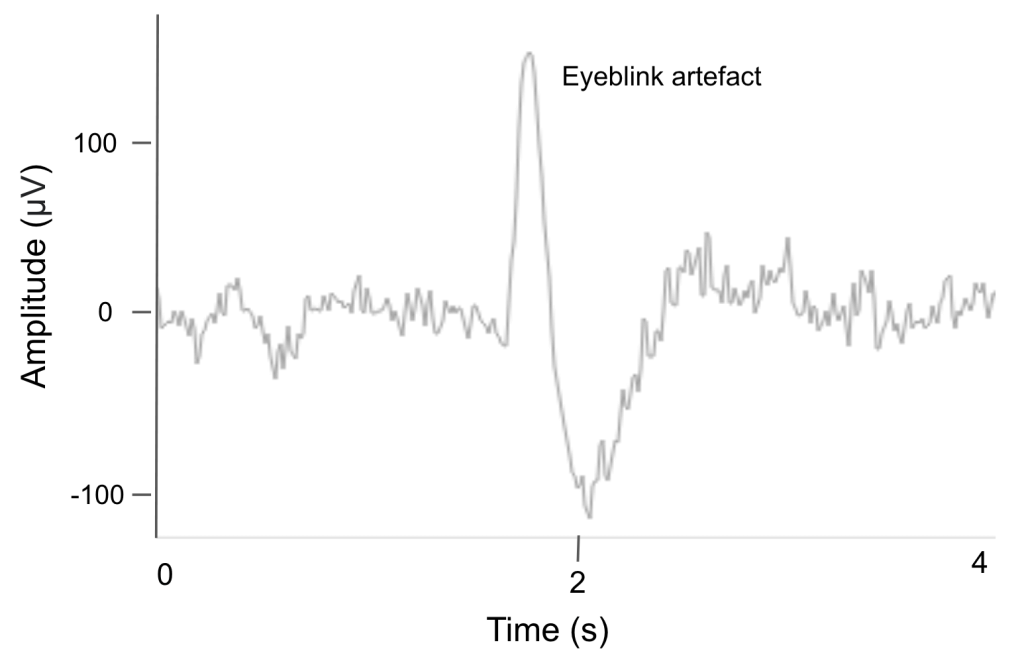
Fig. 8 – Eyeblink artefact in raw EEG.
3.5. Fast Fourier Transform (FFT)
A Fourier transform is the mathematical conversion of the EEG signal from ‘time domain’ (image A) to ‘frequency domain (image B)’.
In the frequency domain, we can quantify how much of each type of oscillation was in our recording. This is typically the ‘power’ of the frequency band and can be displayed a power spectrum (Image B).

Fig. 9A – Raw EEG in time domain.
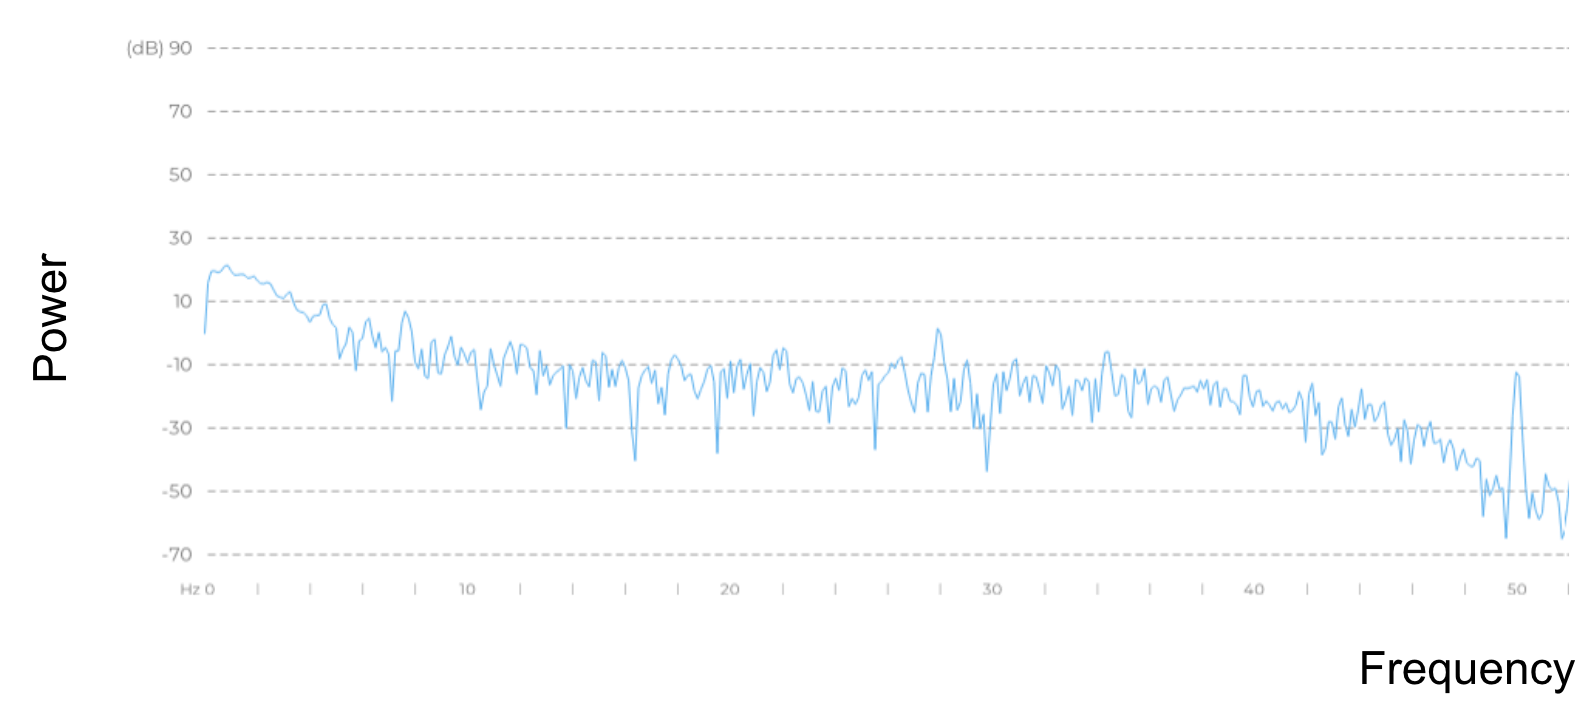
Fig. 9B – Power spectrum after FFT (frequency domain).
3.6. Band Power
Power of a frequency band (e.g. Alpha band) obtained from a fourier transform tells us how much of each frequency band there is. Band power units are typically in µV2/Hz. Most often, amplitude or power spectra from a FFT are shown in the logarithmic unit decibels (dB). The decibel is a unit of ratio between a measured power (P) and a reference power (Pr) as follows:
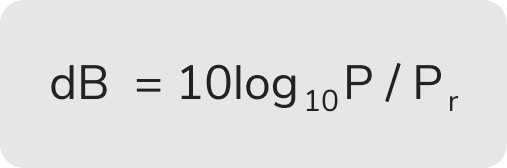
Once this unit of measure is obtained for events of interest, band powers can be compared to understand experimental effects on brain waves.
4. From Theory to Practice
Next, we are going to look at the alpha suppression effect.
This is a phenomenon first reported by Hans Berger, in which we see a significant decrease in the amount of alpha oscillations (alpha power) when someone’s eyes are open compared to when they are closed.

Fig. 10 – An increase alpha oscillations can be seen when eyes are open.
First using EmotivPRO Builder we built a simple experiment. In this experiment a participant is simply asked to keep their eyes open for 2 minutes while focusing on the screen, and then closed for 2 minutes. They would hear a bell at the end of 2 minutes to signal opening their eyes.
You can follow the video below to make your own alpha suppression experiment or you can run our experiment from the link here:
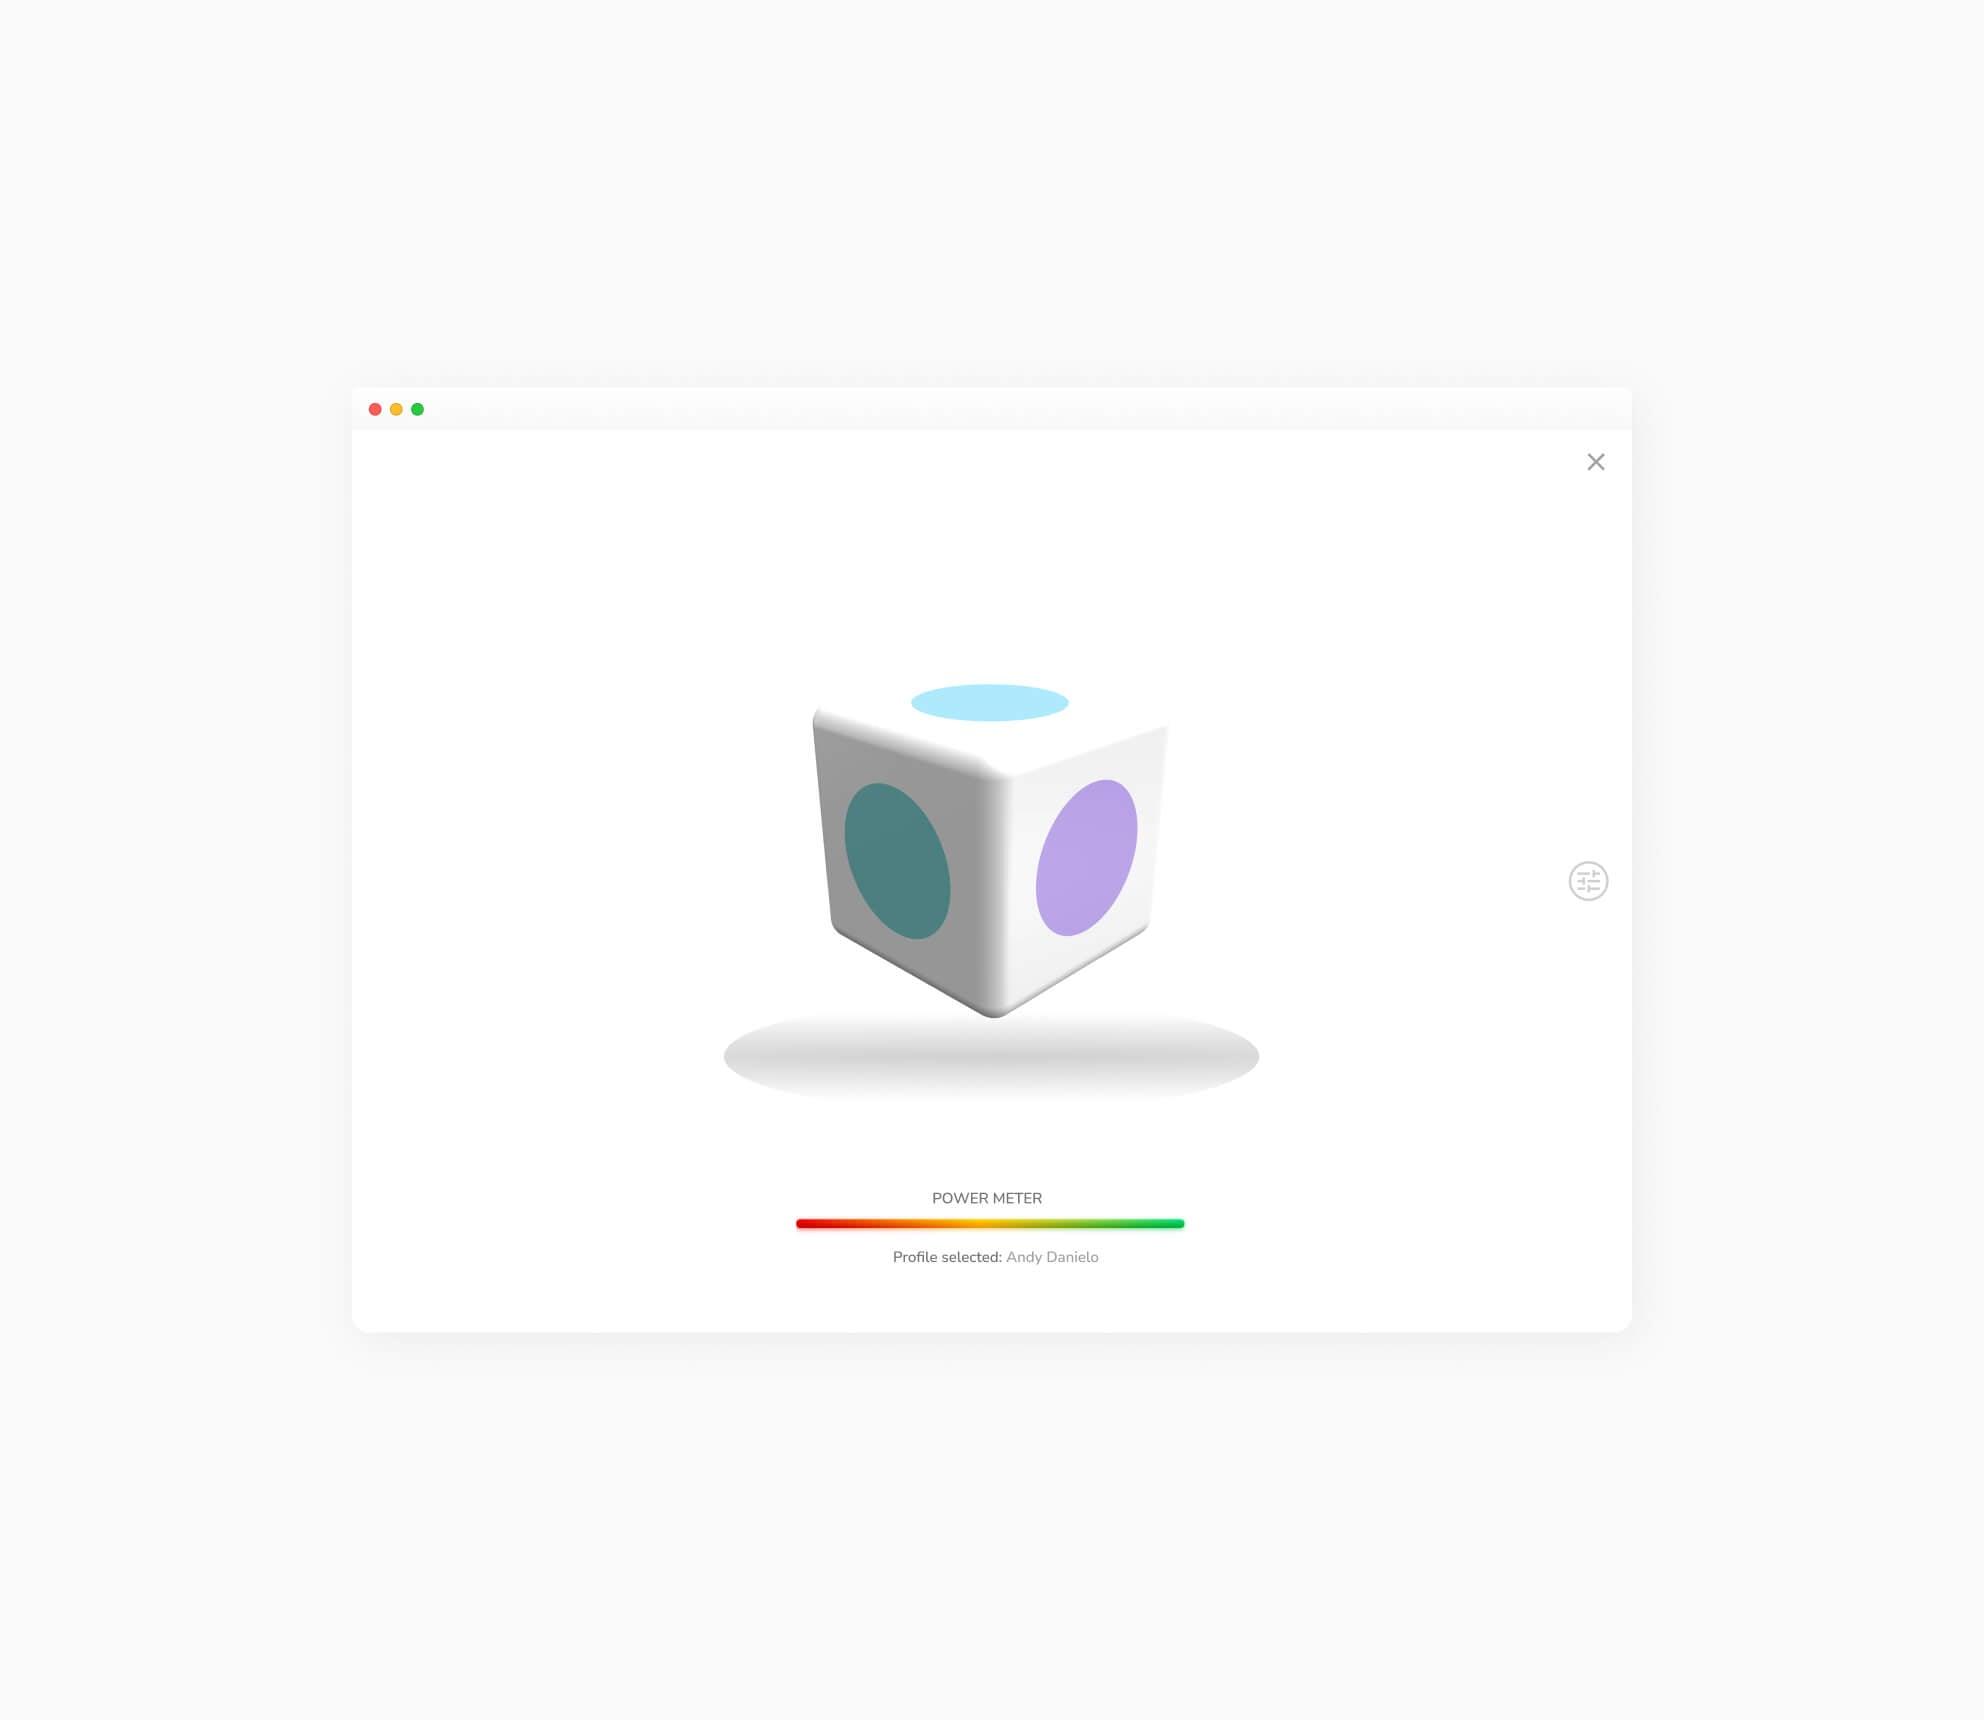
4.1. Device Fitting and EEG Quality
Read more about how our EQ gate works here. Find more info about device fitting specific to your headset here:
- EPOC type
- Insight type
4.2. Processing and transforming the EEG data
Now that you have your data you can transform it to frequency domain using Emotiv Analyzer. Follow the steps in the video.
4.3. Interpreting the data
Once Analyzer is done download the zip file. For each record you will have a csv file with band powers and an image file which you can use to run your own statistical analysis.
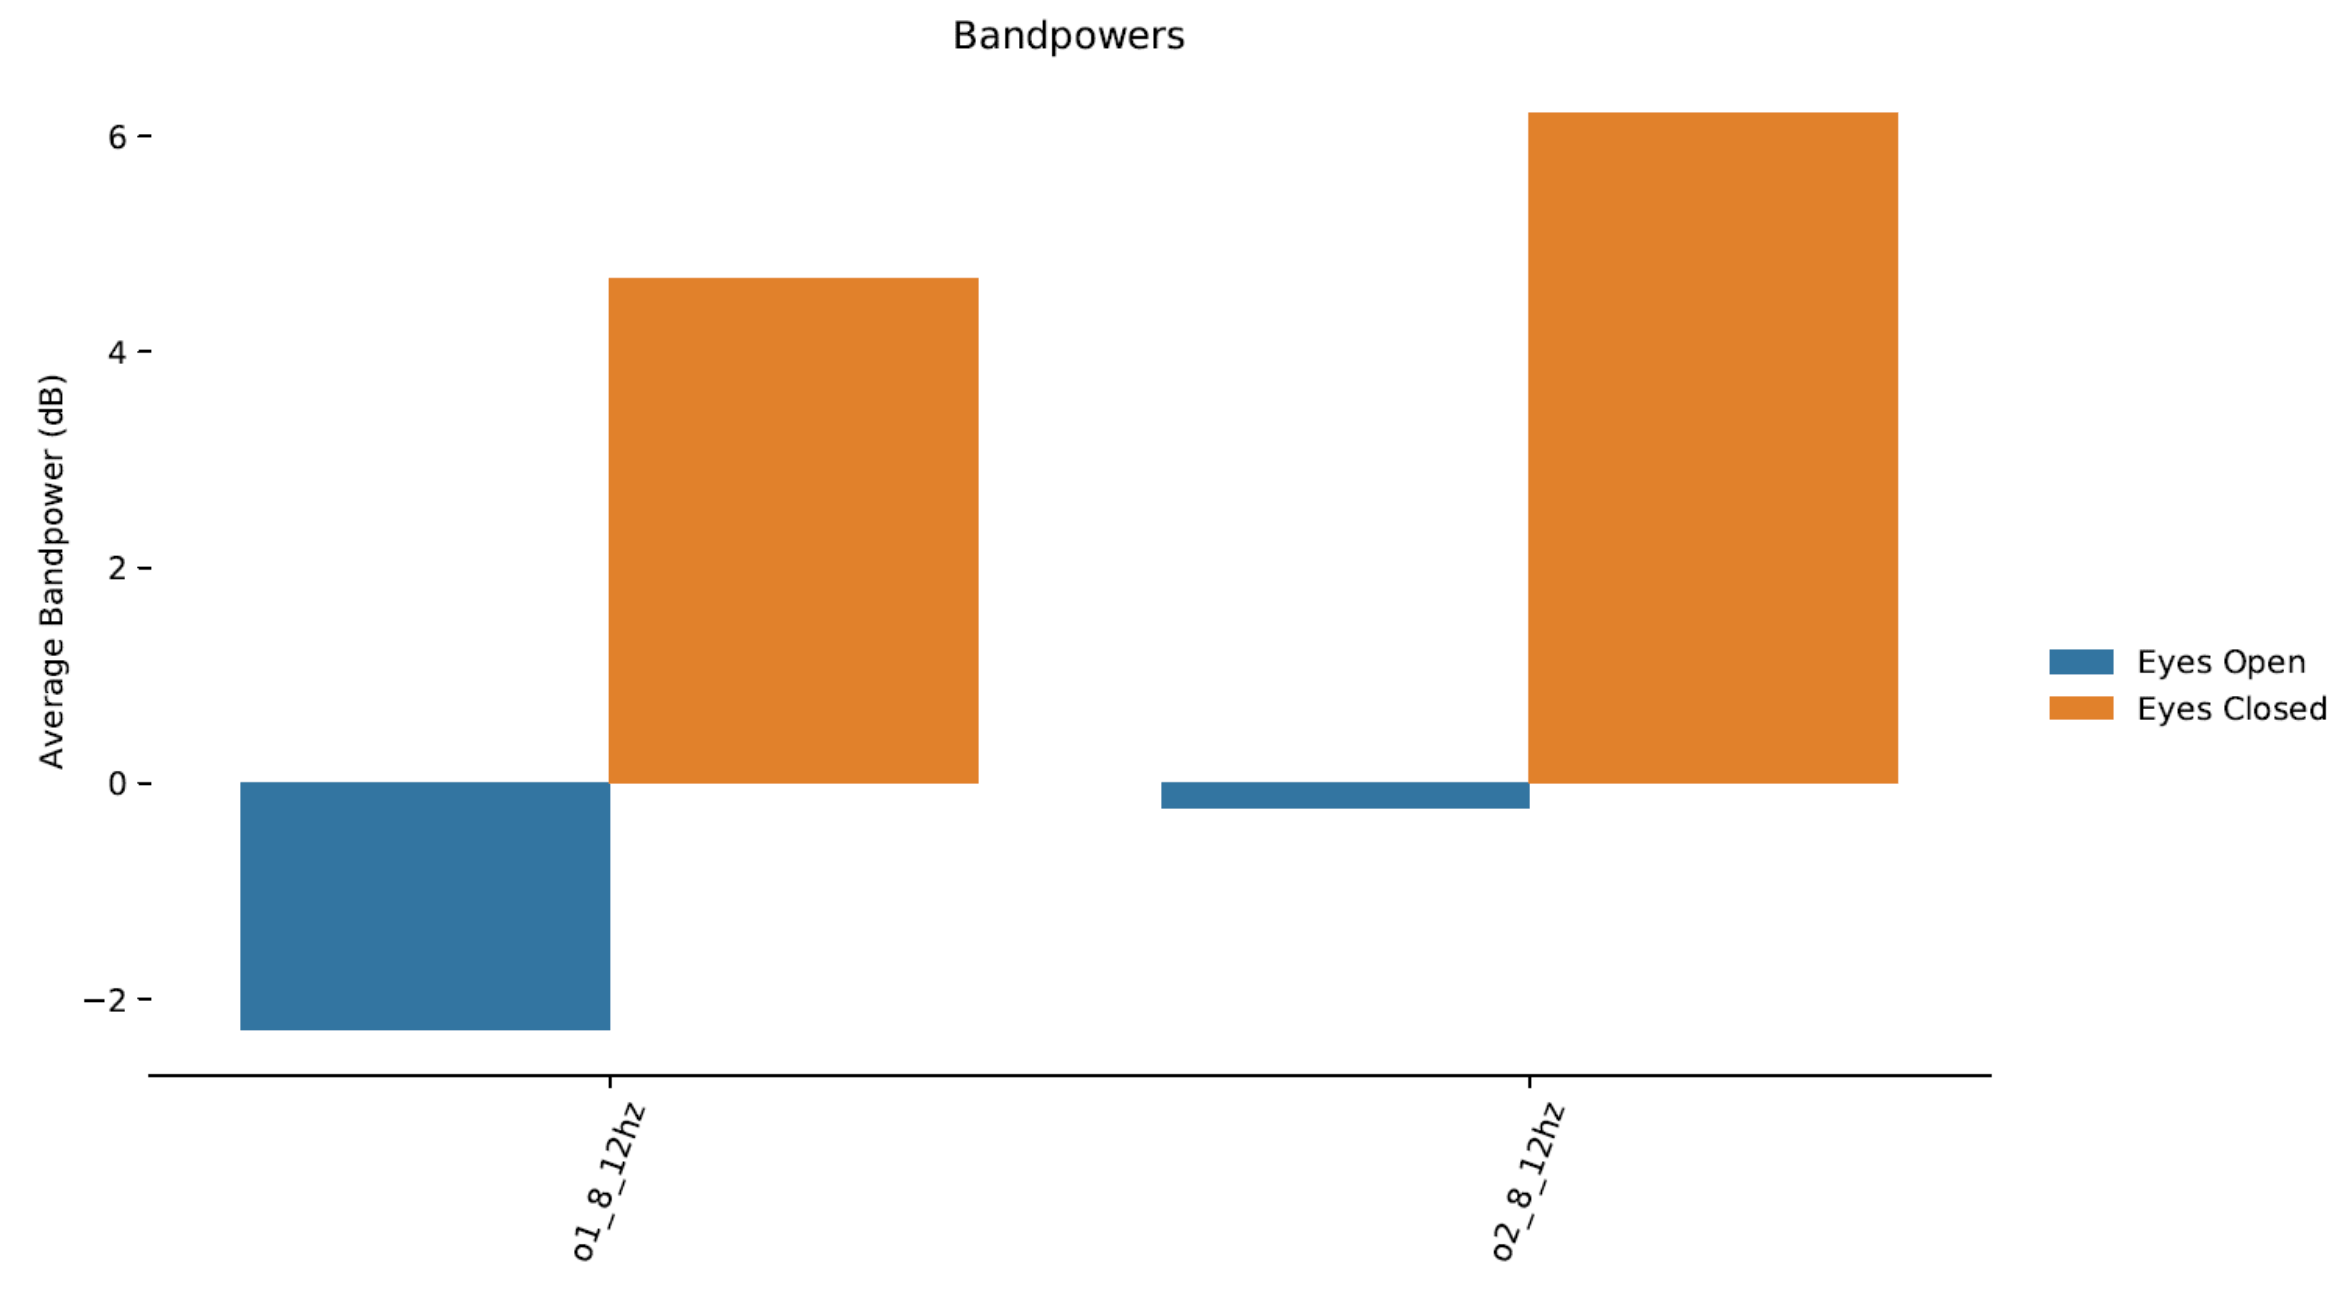
Fig. 11 – Bandpowers.
In our output we can see the increase in Alpha power when eyes were closed (orange) compared to when open (blue).
This is the end of our tutorial! You are now equipped with the basics 🙂
You can find some links to a more advanced reading in the resources section.
5. Resources
ADVANCED READING
Donoghue et al. 2022 Methodological considerations for studying neural oscillations
GLOSSARY OF EEG TERMINOLOGY
Kane et al. 2017 (here)
OPEN SOURCE CODE
If you are comfortable with python coding, we have made available python scripts which you can use to obtain alpha power values, labeled by eyes-open and eyes-closed segments. Find the code and sample Alpha Suppression data files here: https://osf.io/9bvgh/
7. References
Donoghue, T., Schaworonkow, N. and Voytek, B., 2022. Methodological considerations for studying neural oscillations. European journal of neuroscience, 55(11-12), pp.3502-3527. doi: https://doi.org/10.1111/ejn.15361
Kane, N., Acharya, J., Beniczky, S., Caboclo, L., Finnigan, S., Kaplan, P.W., Shibasaki, H., Pressler, R. and van Putten, M.J., 2017. A revised glossary of terms most commonly used by clinical electroencephalographers and updated proposal for the report format of the EEG findings. Revision 2017. Clinical neurophysiology practice, 2, p.170. doi: 10.1016/j.cnp.2017.07.002
Siuly, S., Li, Y., Zhang, Y. (2016). Electroencephalogram (EEG) and Its Background. In: EEG Signal Analysis and Classification. Health Information Science. Springer, Cham. doi: https://doi.org/10.1007/978-3-319-47653-7_1